Results — Technology Recommendations
NoteAt a glance
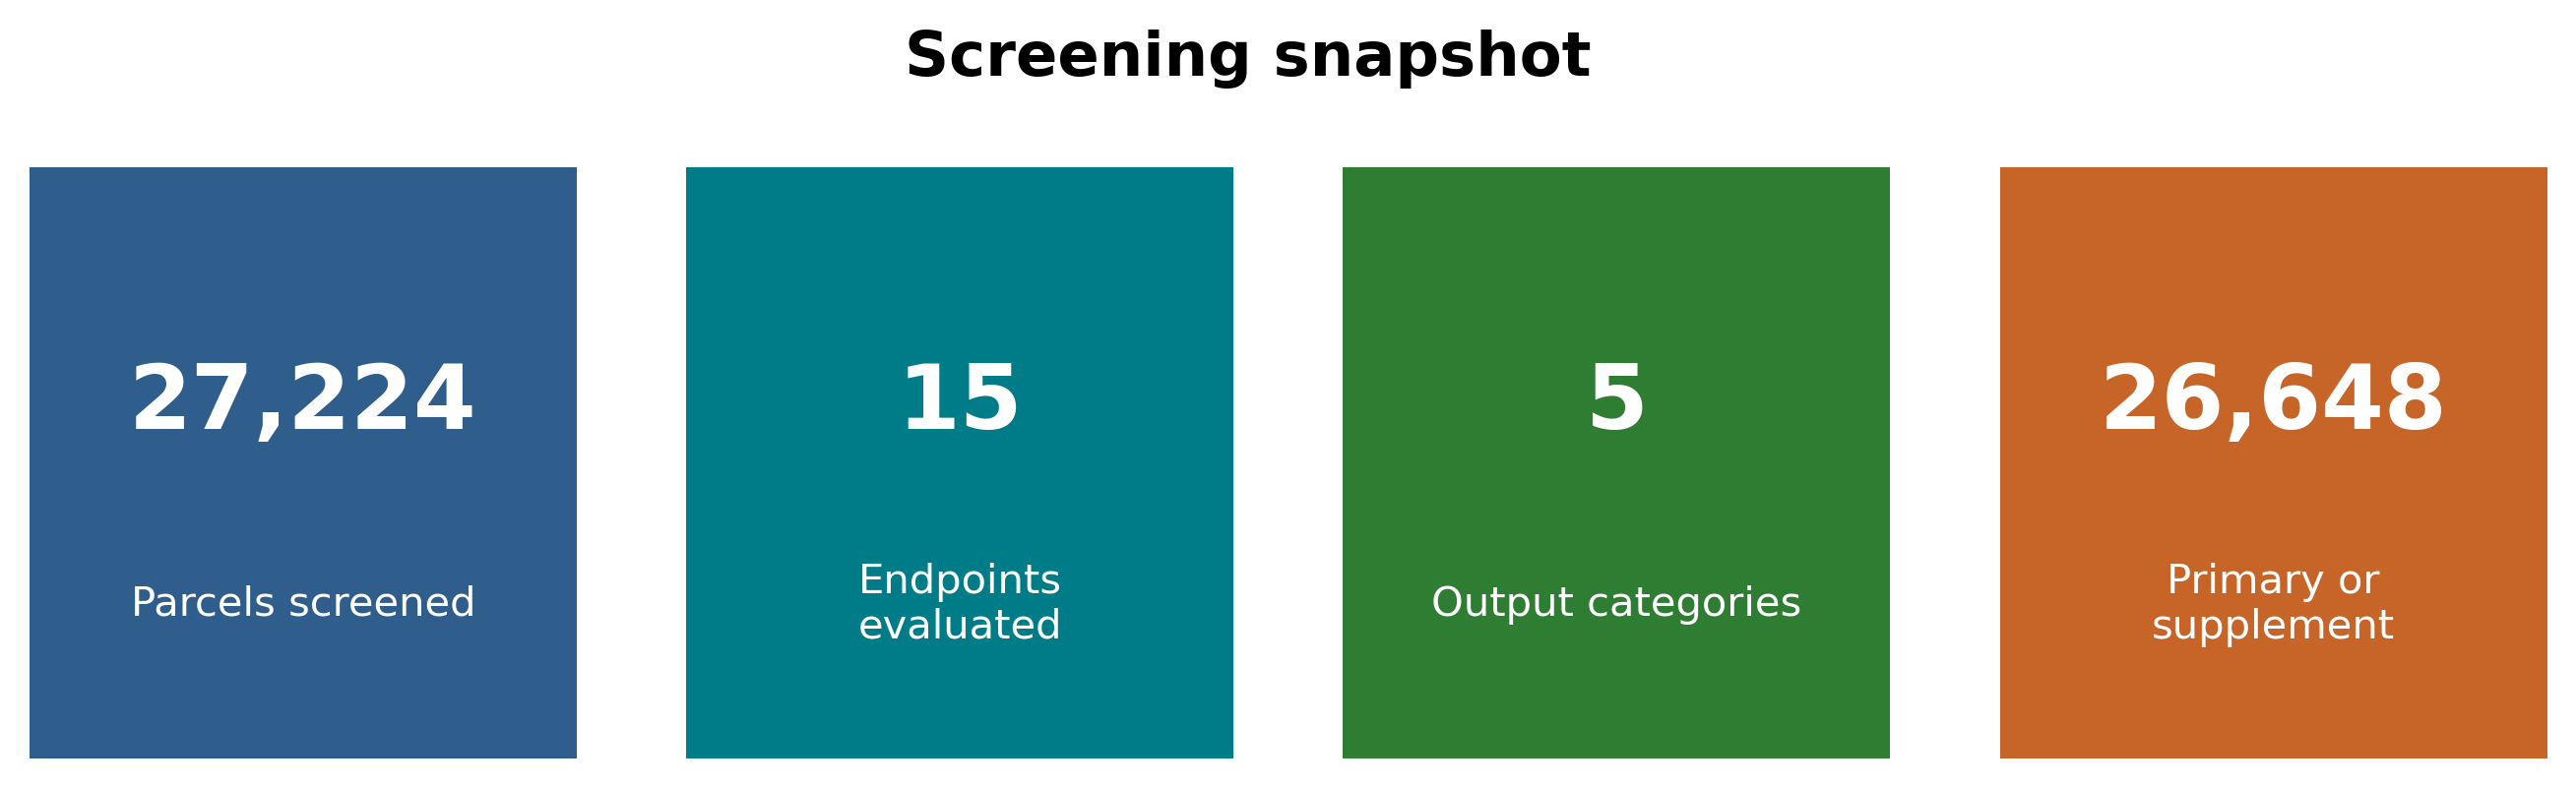
- Output date: 2026-04-28
- Coverage: 27,224 parcels screened across 15 endpoints
- Endpoints: E01-E13, ES1, ES2
- Output categories: 5
This output covers the pilot islands only. See Start Here for the remaining-island scope.
Key links and downloads
- Technology screening GeoPackage and CSV folder:
data/03_processed/tech_screening/ - Technology screening GeoPackage:
20260428_tech_screening_32604.gpkg - Spreadsheet:
20260428_tech_screening.csv - Schema: Methods, Screen Techs, Output schema. The standalone README documents an older output schema.
- Map viewer: Hawaii OSDS Technology Suitability Analysis Map (Pilot)
- Method: Screen Techs
Snapshot
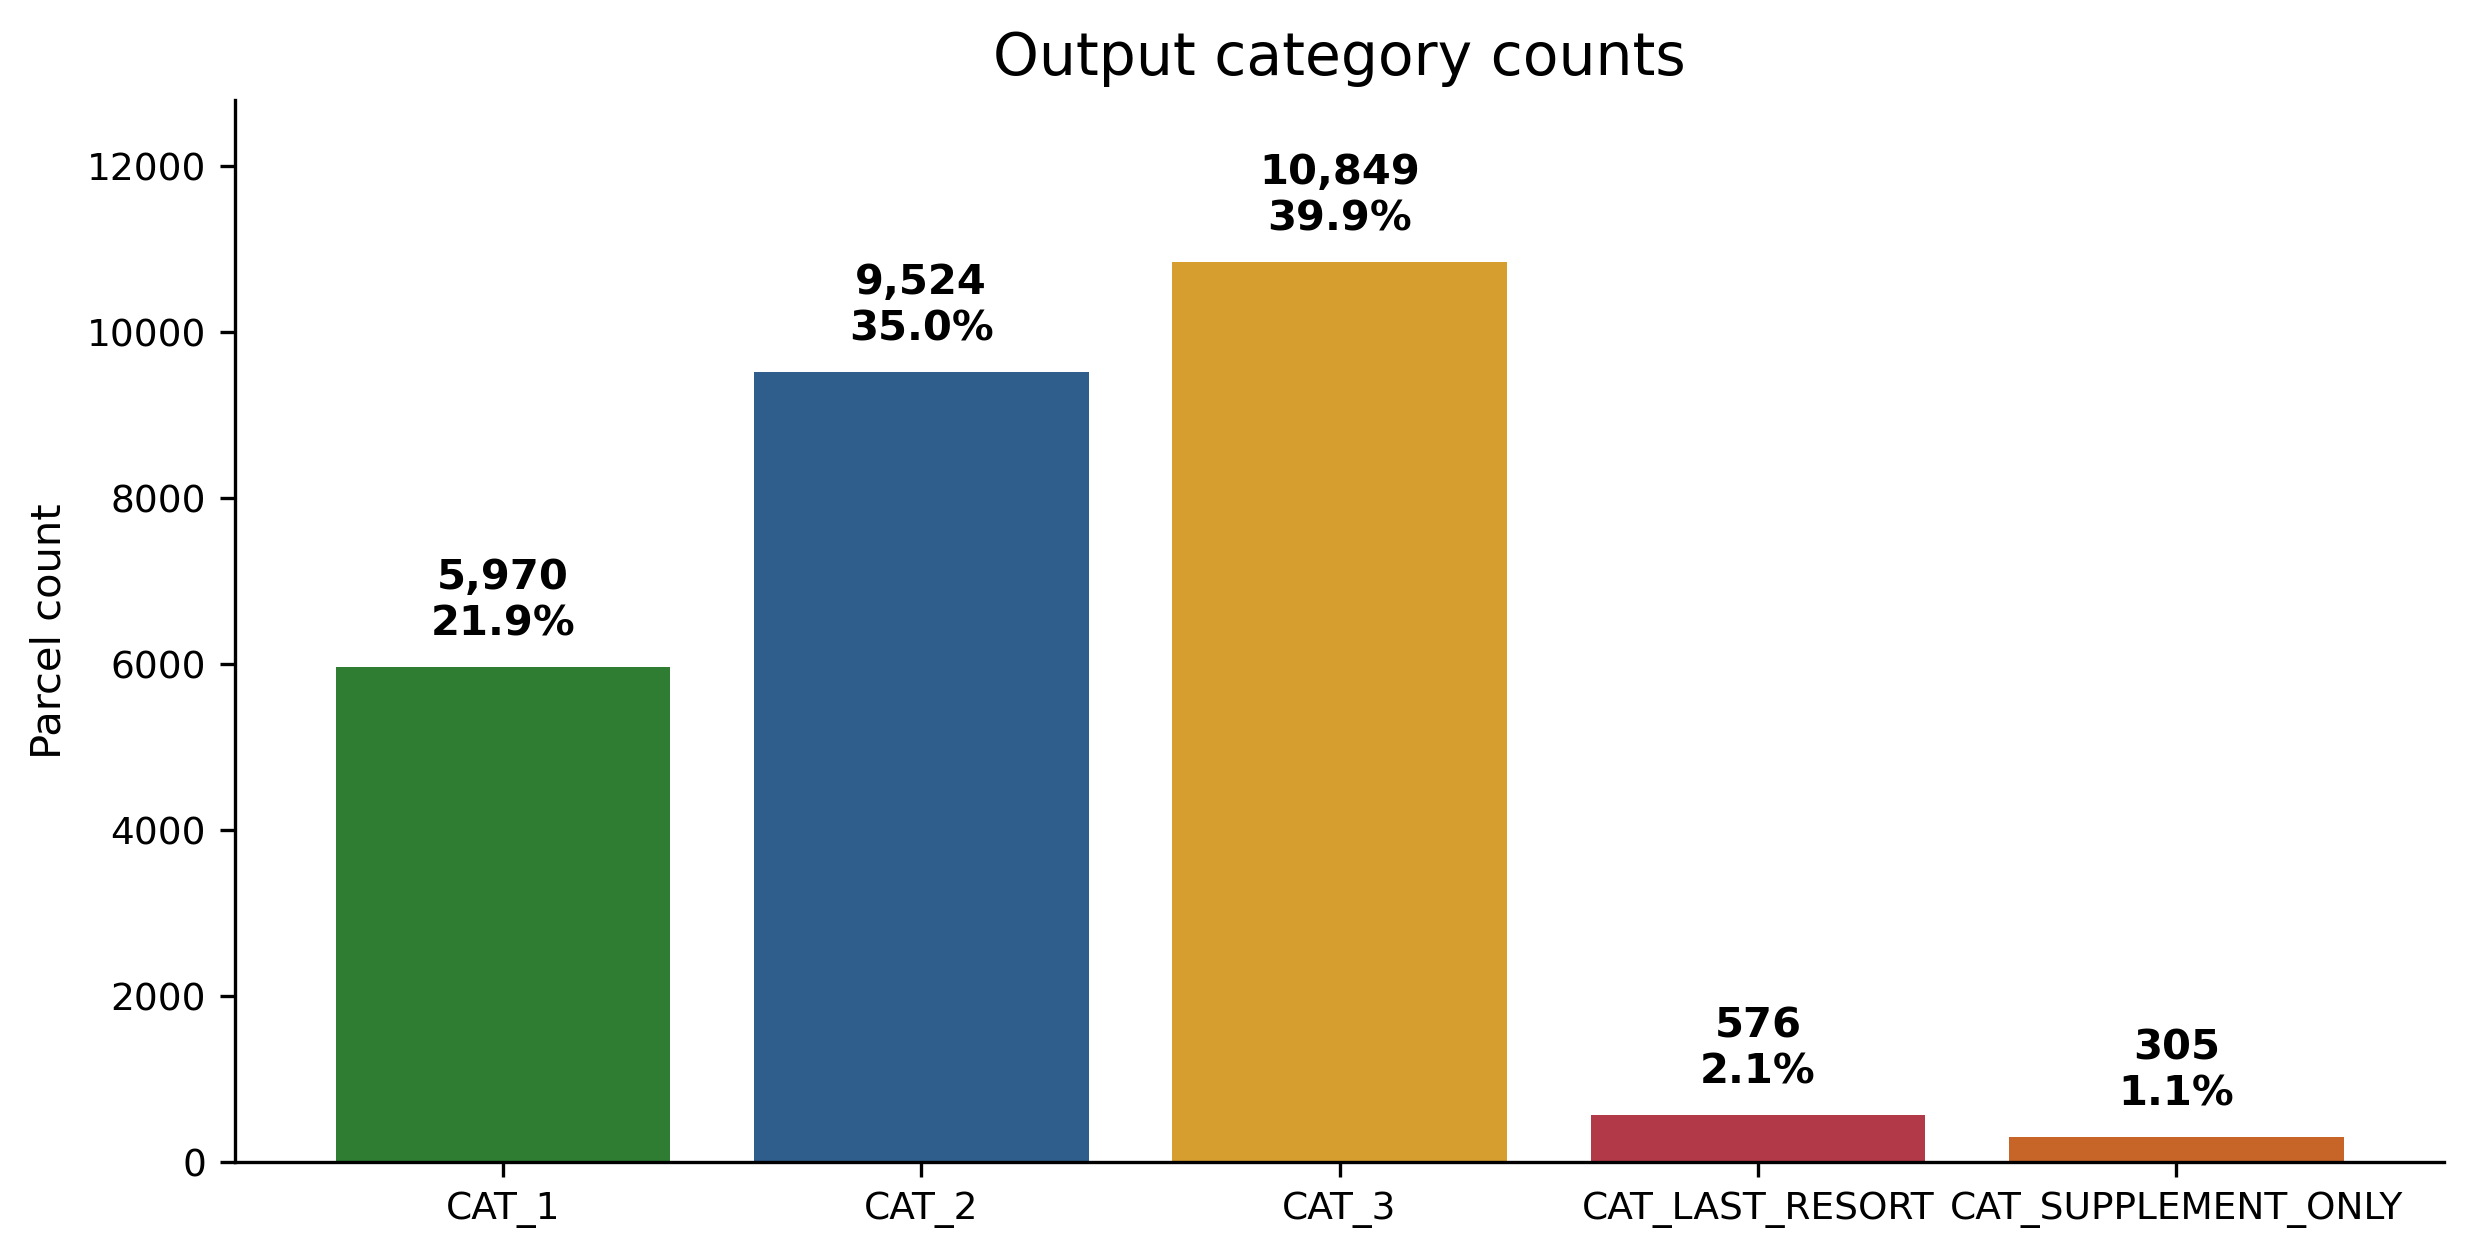
Output category counts
| Category | Count | Percent |
|---|---|---|
CAT_1 |
5,970 | 21.93% |
CAT_2 |
9,524 | 34.98% |
CAT_3 |
10,849 | 39.85% |
CAT_LAST_RESORT |
576 | 2.12% |
CAT_SUPPLEMENT_ONLY |
305 | 1.12% |
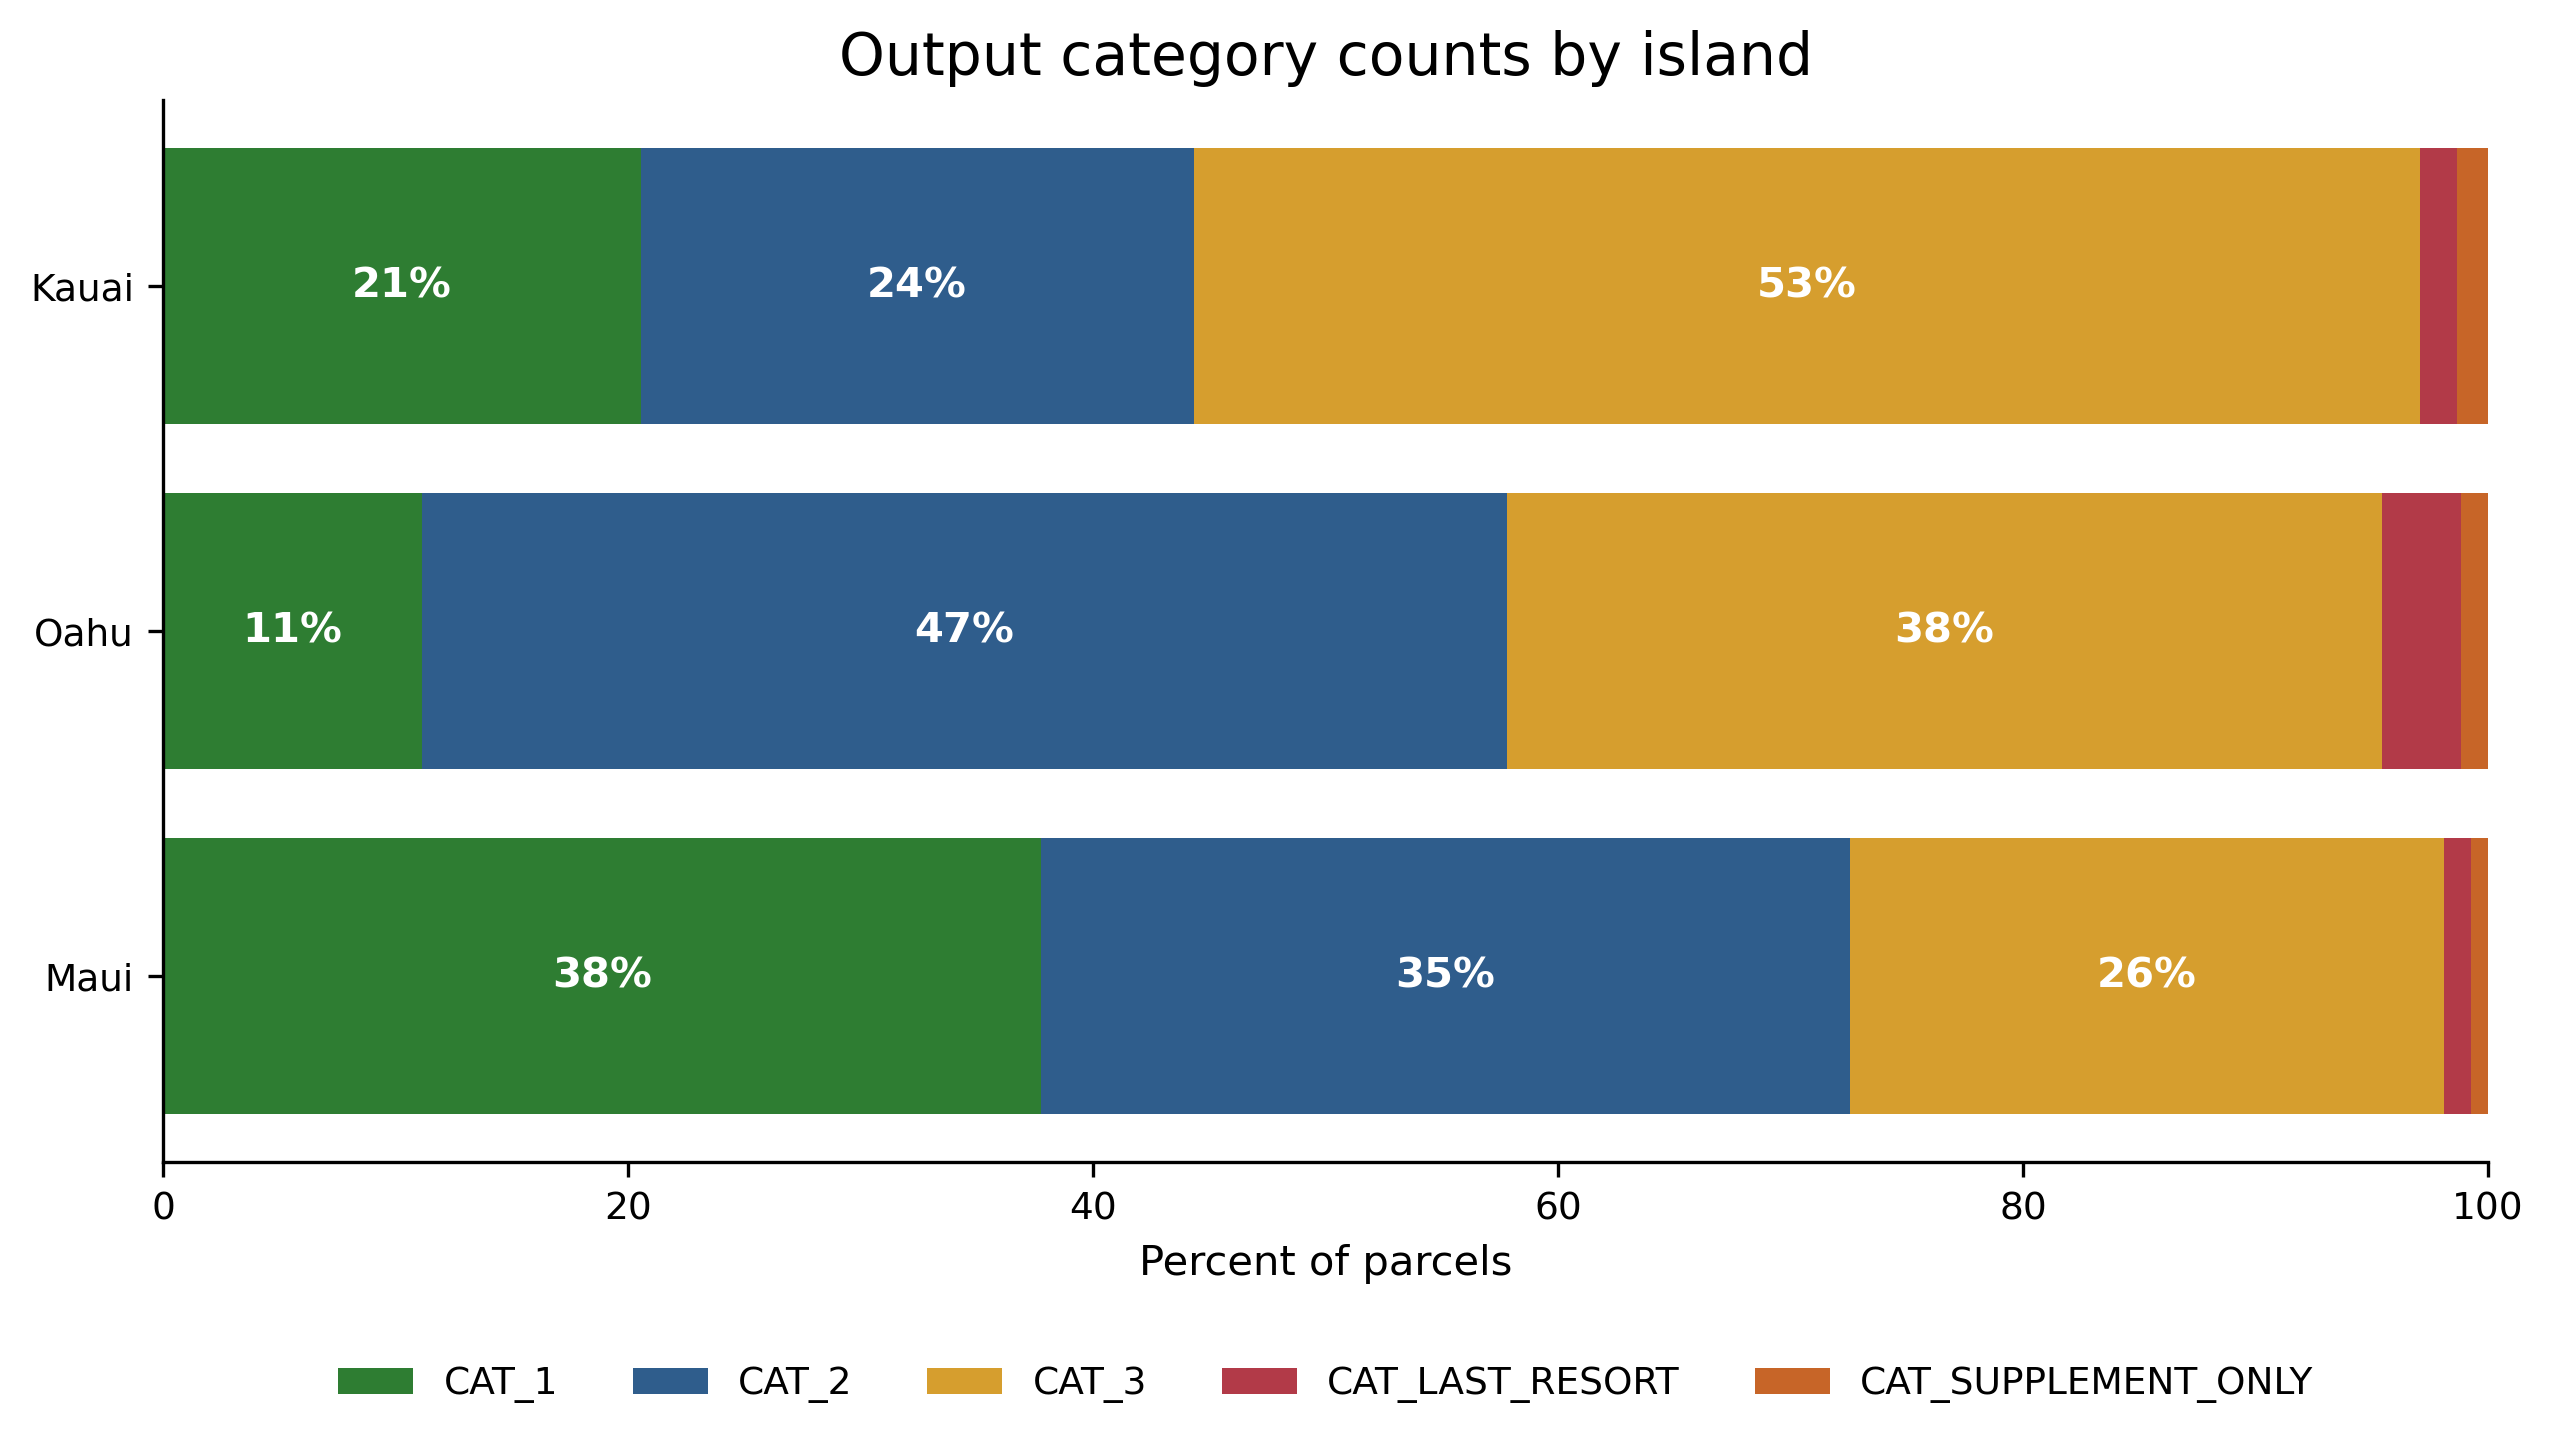
Output category counts by island
| Island | CAT_1 |
CAT_2 |
CAT_3 |
CAT_LAST_RESORT |
CAT_SUPPLEMENT_ONLY |
Total |
|---|---|---|---|---|---|---|
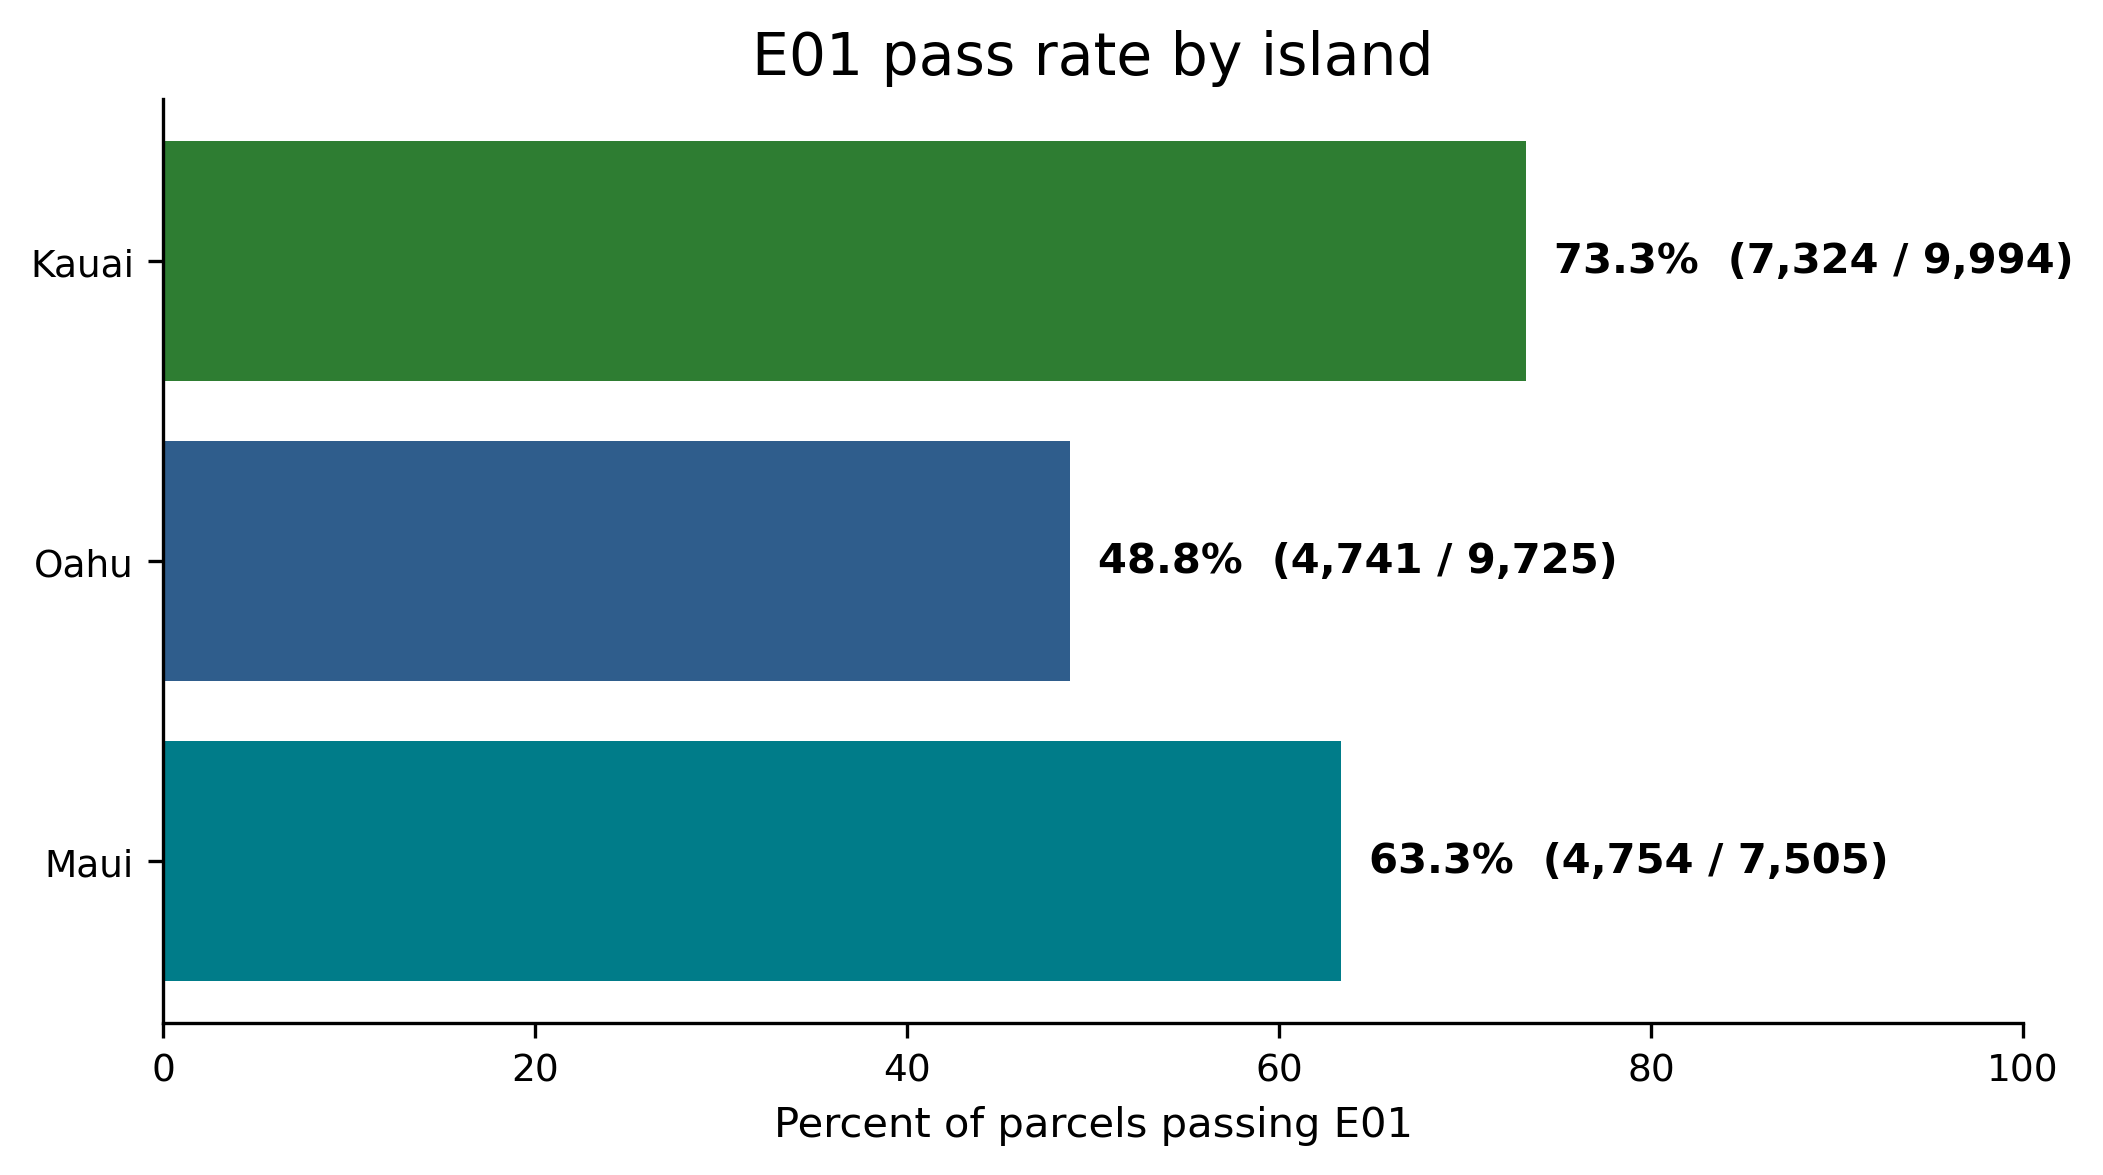
| Kauai | 2,053 | 2,376 | 5,271 | 159 | 135 | 9,994 |
| Maui | 2,834 | 2,610 | 1,920 | 85 | 56 | 7,505 |
| Oahu | 1,083 | 4,538 | 3,658 | 332 | 114 | 9,725 |
| Total | 5,970 | 9,524 | 10,849 | 576 | 305 | 27,224 |
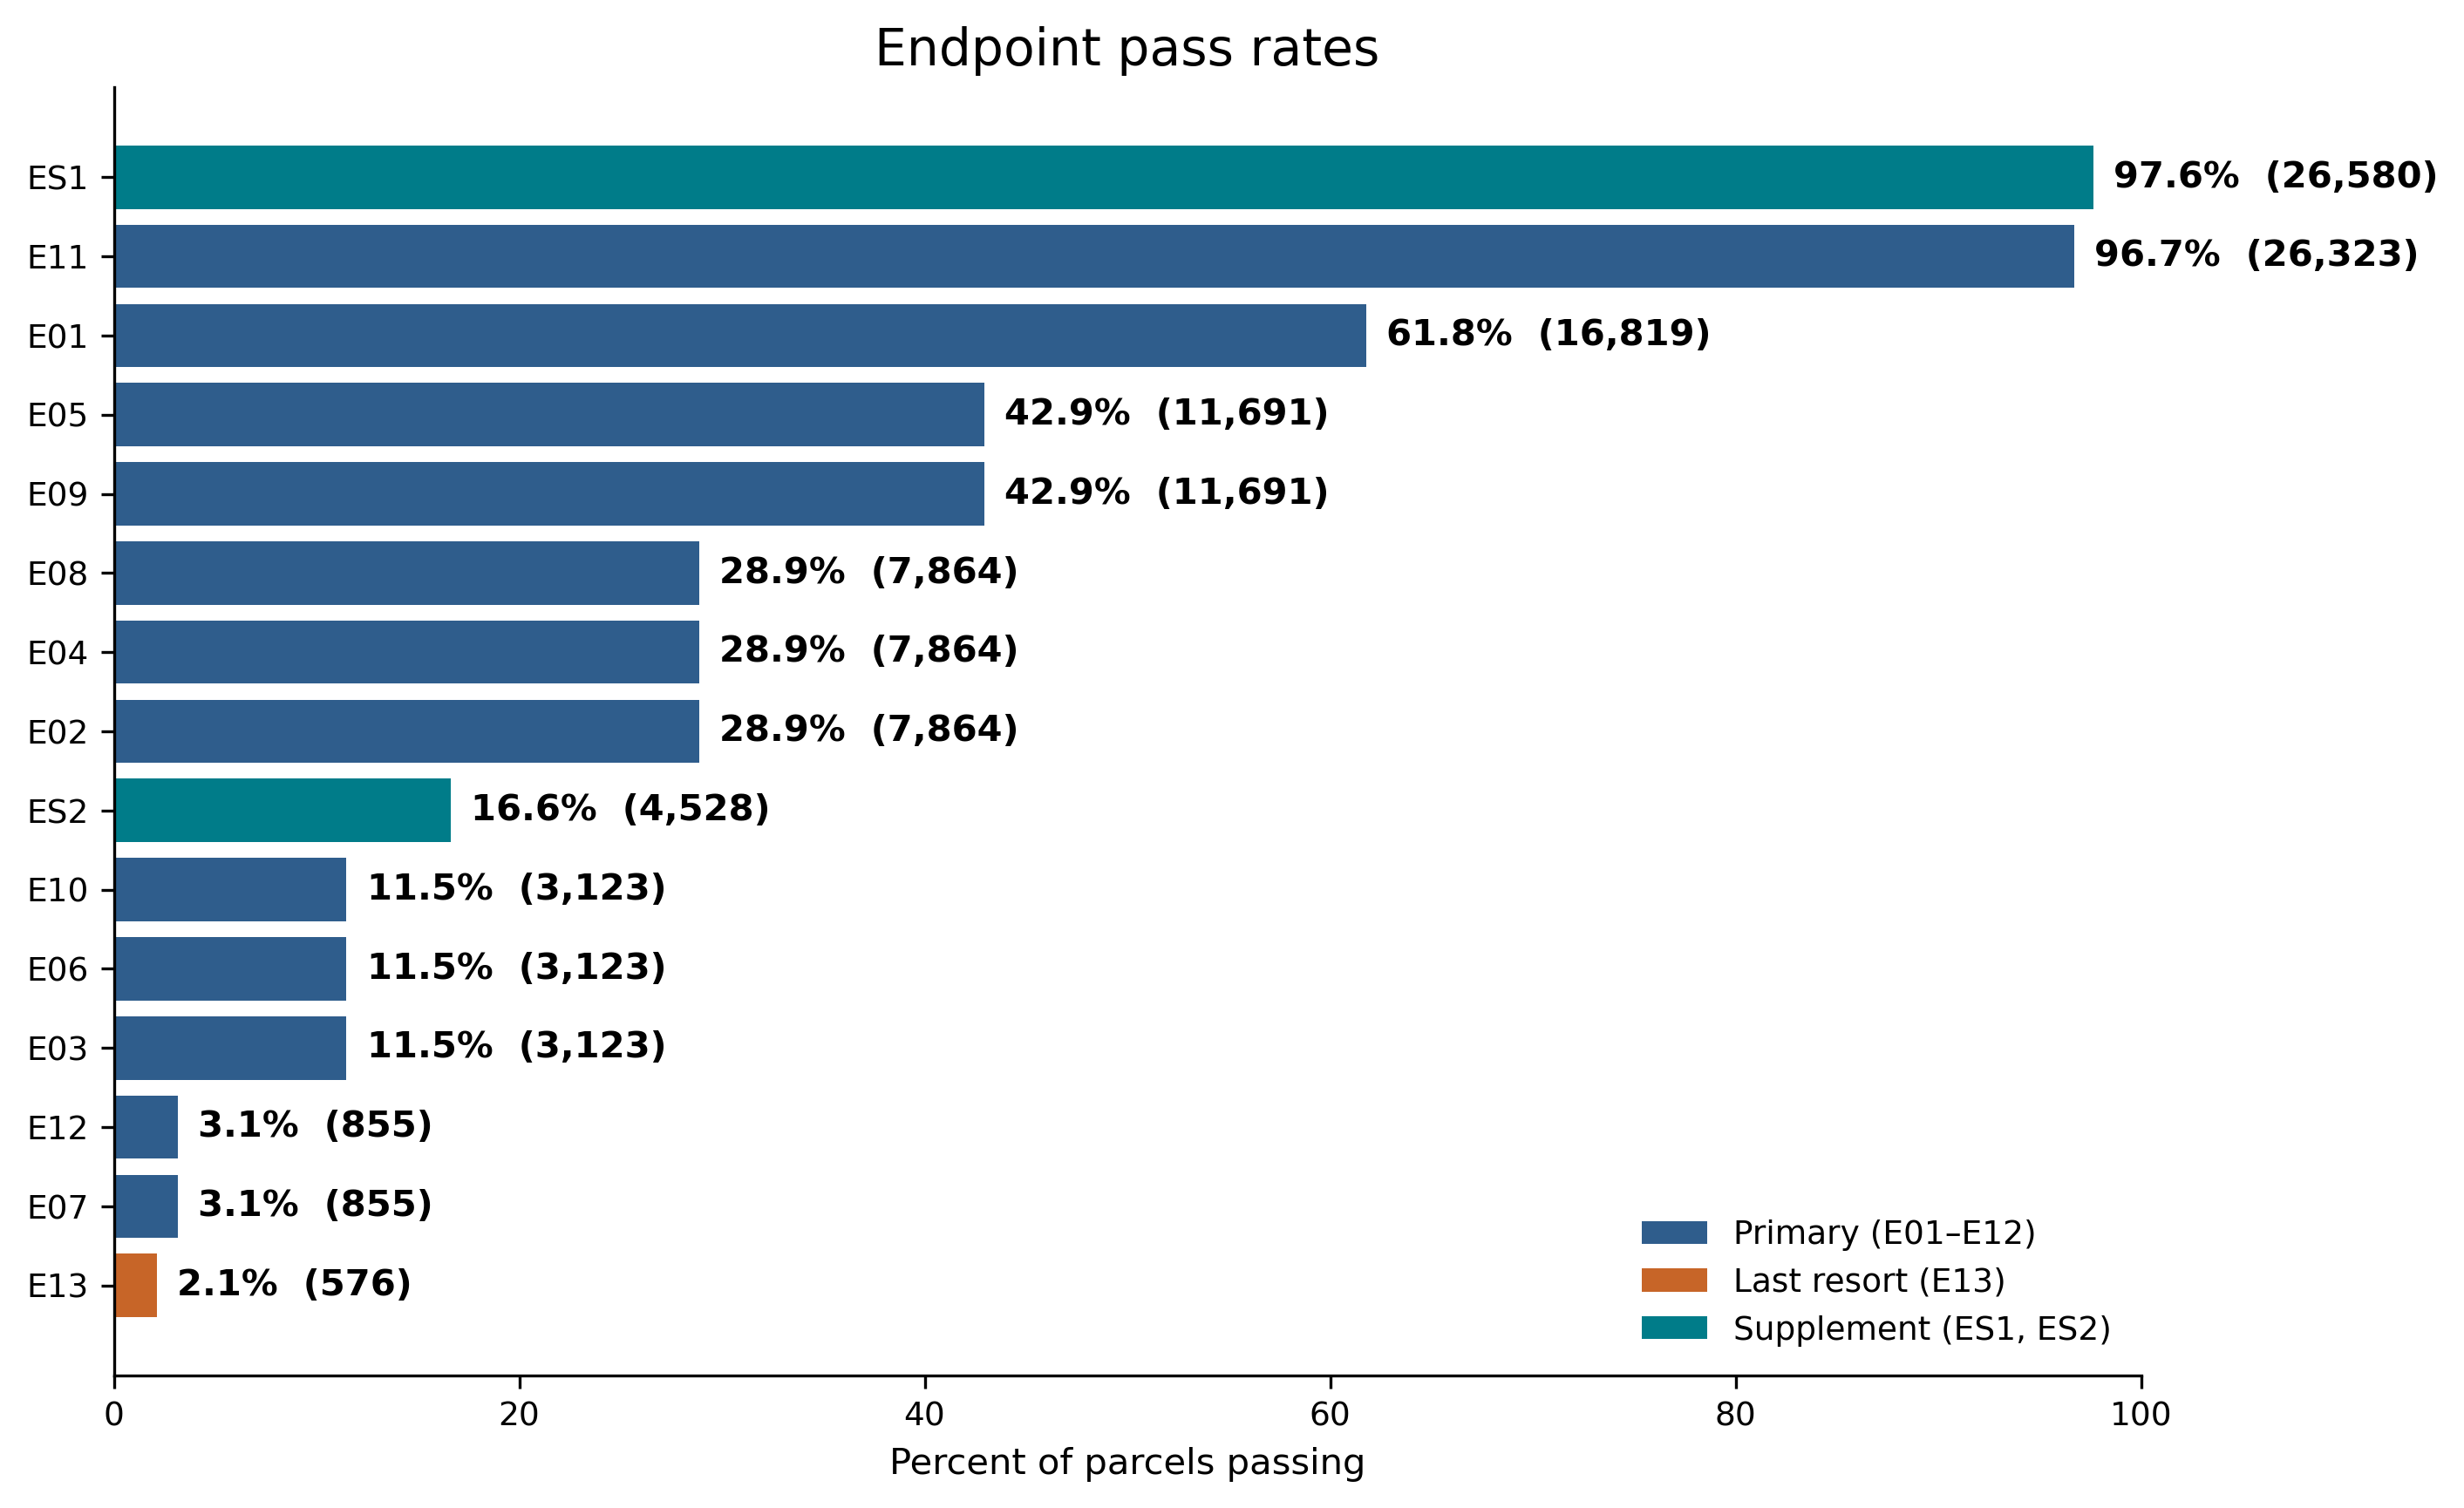
Endpoint pass counts
| Endpoint | Pass count | Percent |
|---|---|---|
E01 |
16,819 | 61.78% |
E02 |
7,864 | 28.89% |
E03 |
3,123 | 11.47% |
E04 |
7,864 | 28.89% |
E05 |
11,691 | 42.94% |
E06 |
3,123 | 11.47% |
E07 |
855 | 3.14% |
E08 |
7,864 | 28.89% |
E09 |
11,691 | 42.94% |
E10 |
3,123 | 11.47% |
E11 |
26,323 | 96.69% |
E12 |
855 | 3.14% |
E13 |
576 | 2.12% |
ES1 |
26,580 | 97.63% |
ES2 |
4,528 | 16.63% |
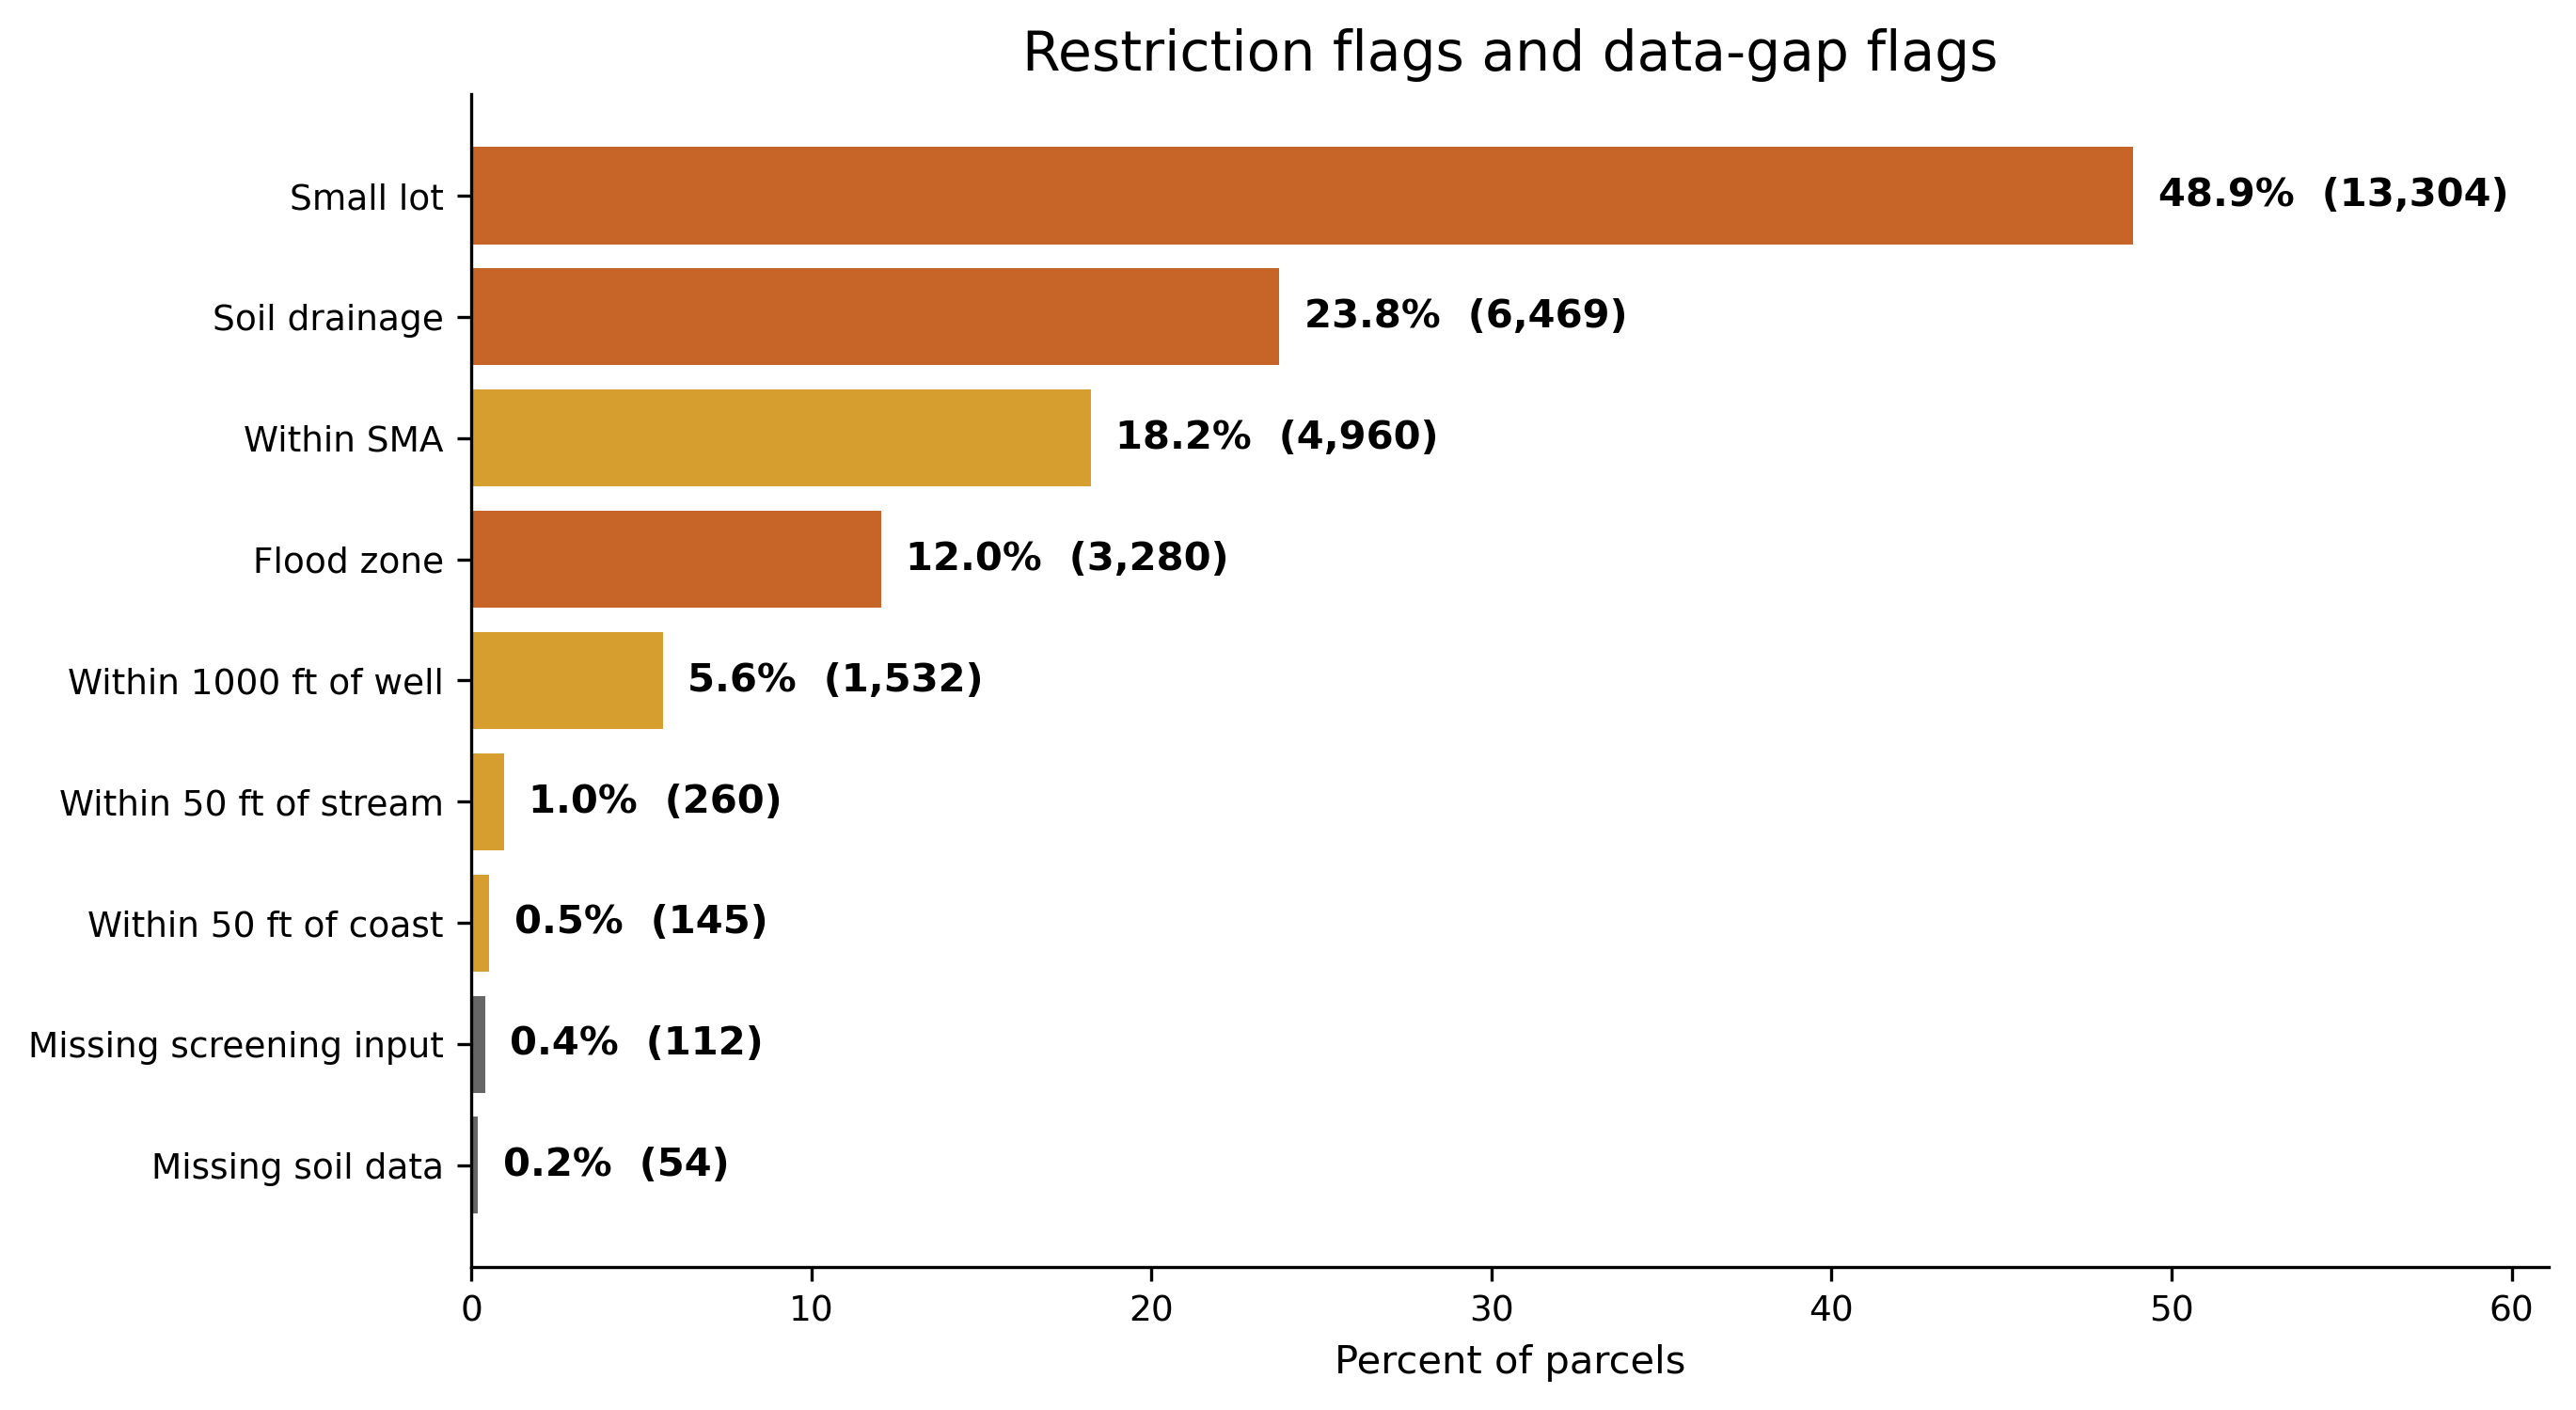
Planning flag and data-gap counts
| Flag | Count | Percent |
|---|---|---|
Small lot (flag_lot_size) |
13,304 | 48.87% |
Soil drainage (flag_soil_drainage) |
6,469 | 23.76% |
Within SMA (rf_within_sma) |
4,960 | 18.22% |
Flood zone (flag_flood) |
3,280 | 12.05% |
Within 1,000 ft of well (rf_within_1000_ft_of_well) |
1,532 | 5.63% |
Within 50 ft of stream (rf_within_50_ft_of_stream) |
260 | 0.96% |
Within 50 ft of coast (rf_within_50_ft_of_coast) |
145 | 0.53% |
Missing screening input (flag_missing_any_screening_input) |
112 | 0.41% |
Missing soil data (flag_soil_data_gap) |
54 | 0.20% |
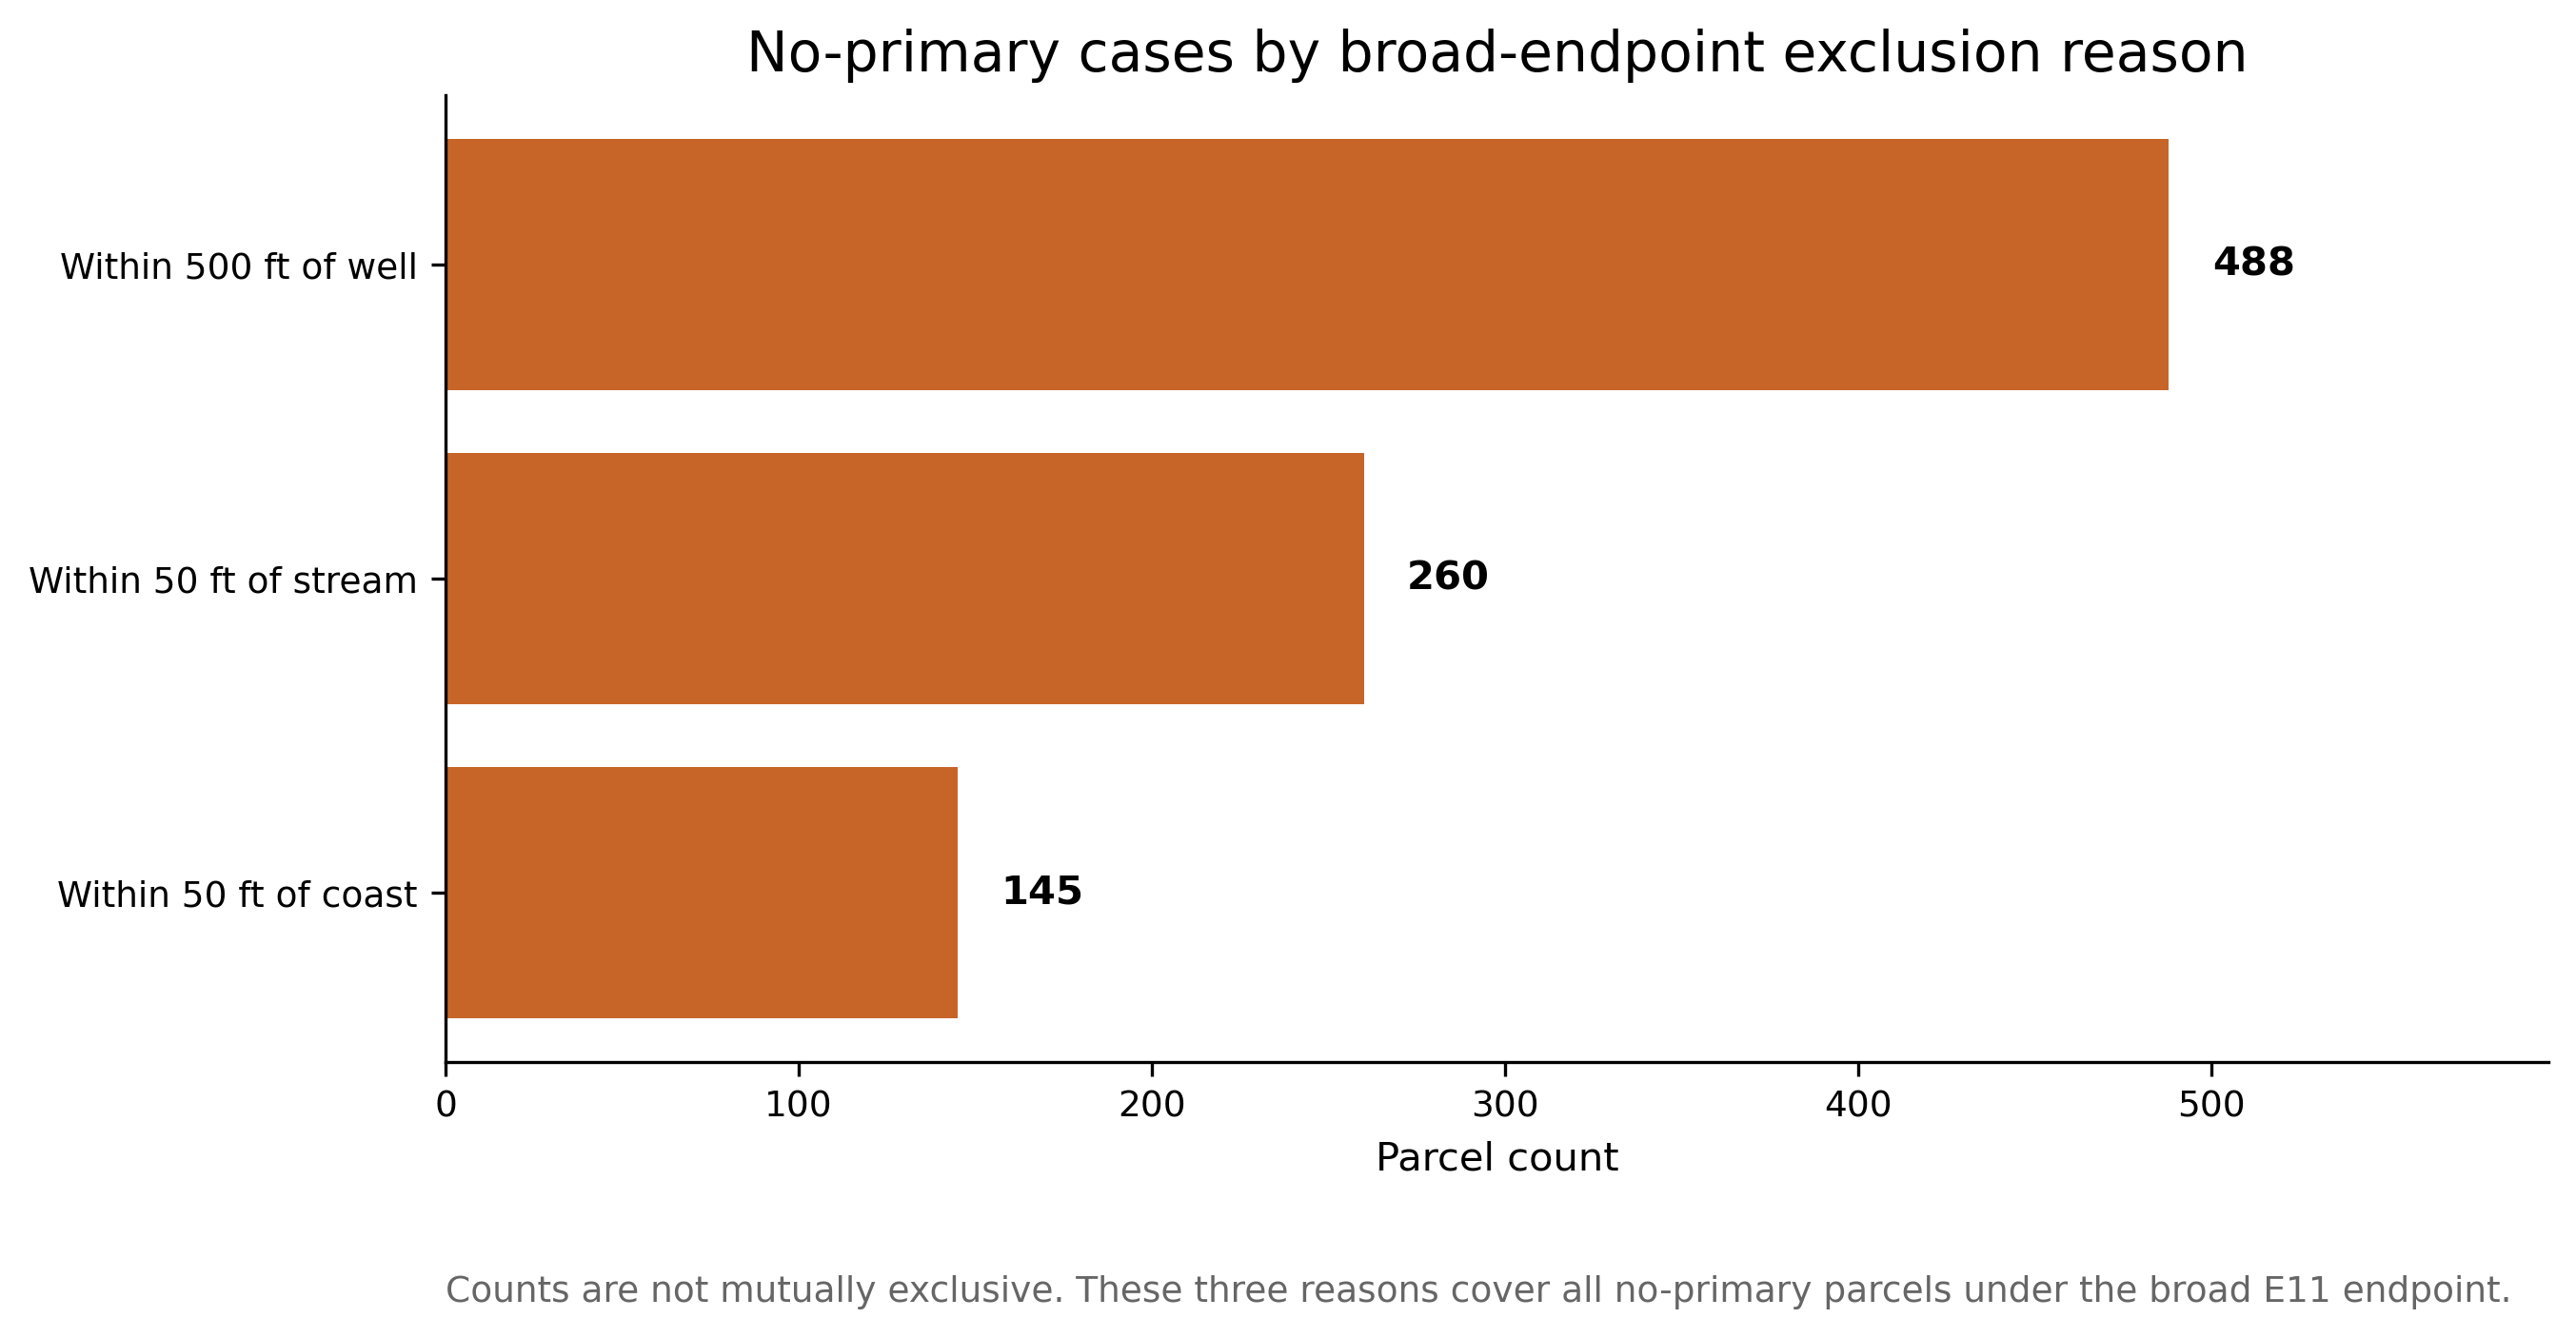
No-primary-endpoint cases
E01 pass rate by island
Field reference
Per-parcel flag columns used in the screening logic include flag_lot_size, flag_soil_drainage, flag_flood, flag_missing_gw, flag_missing_slope, flag_missing_ksat, flag_missing_perc, flag_soil_data_gap, and flag_missing_any_screening_input. See the output schema for field definitions.