Results — MPAT
NoteAt a glance
- Output date: 2026-04-28
- Coverage: 27,224 cesspool-bearing parcels and 34,142 cesspools
- Pilot islands: Maui, Oahu, Kauai
- CRS: EPSG:32604
This output covers the pilot islands only. See Start Here for the remaining-island scope.
Key links and downloads
- MPAT GeoPackage and CSV folder:
data/03_processed/mpat/ - MPAT GeoPackage:
20260428_mpat_32604.gpkg - Spreadsheet:
20260428_mpat.csv - Parcel analysis points:
20260428_parcel_analysis_points.gpkg - Schema: MPAT README
- Map viewer: Hawaii OSDS Technology Suitability Analysis Map (Pilot)
- Method: Build MPAT
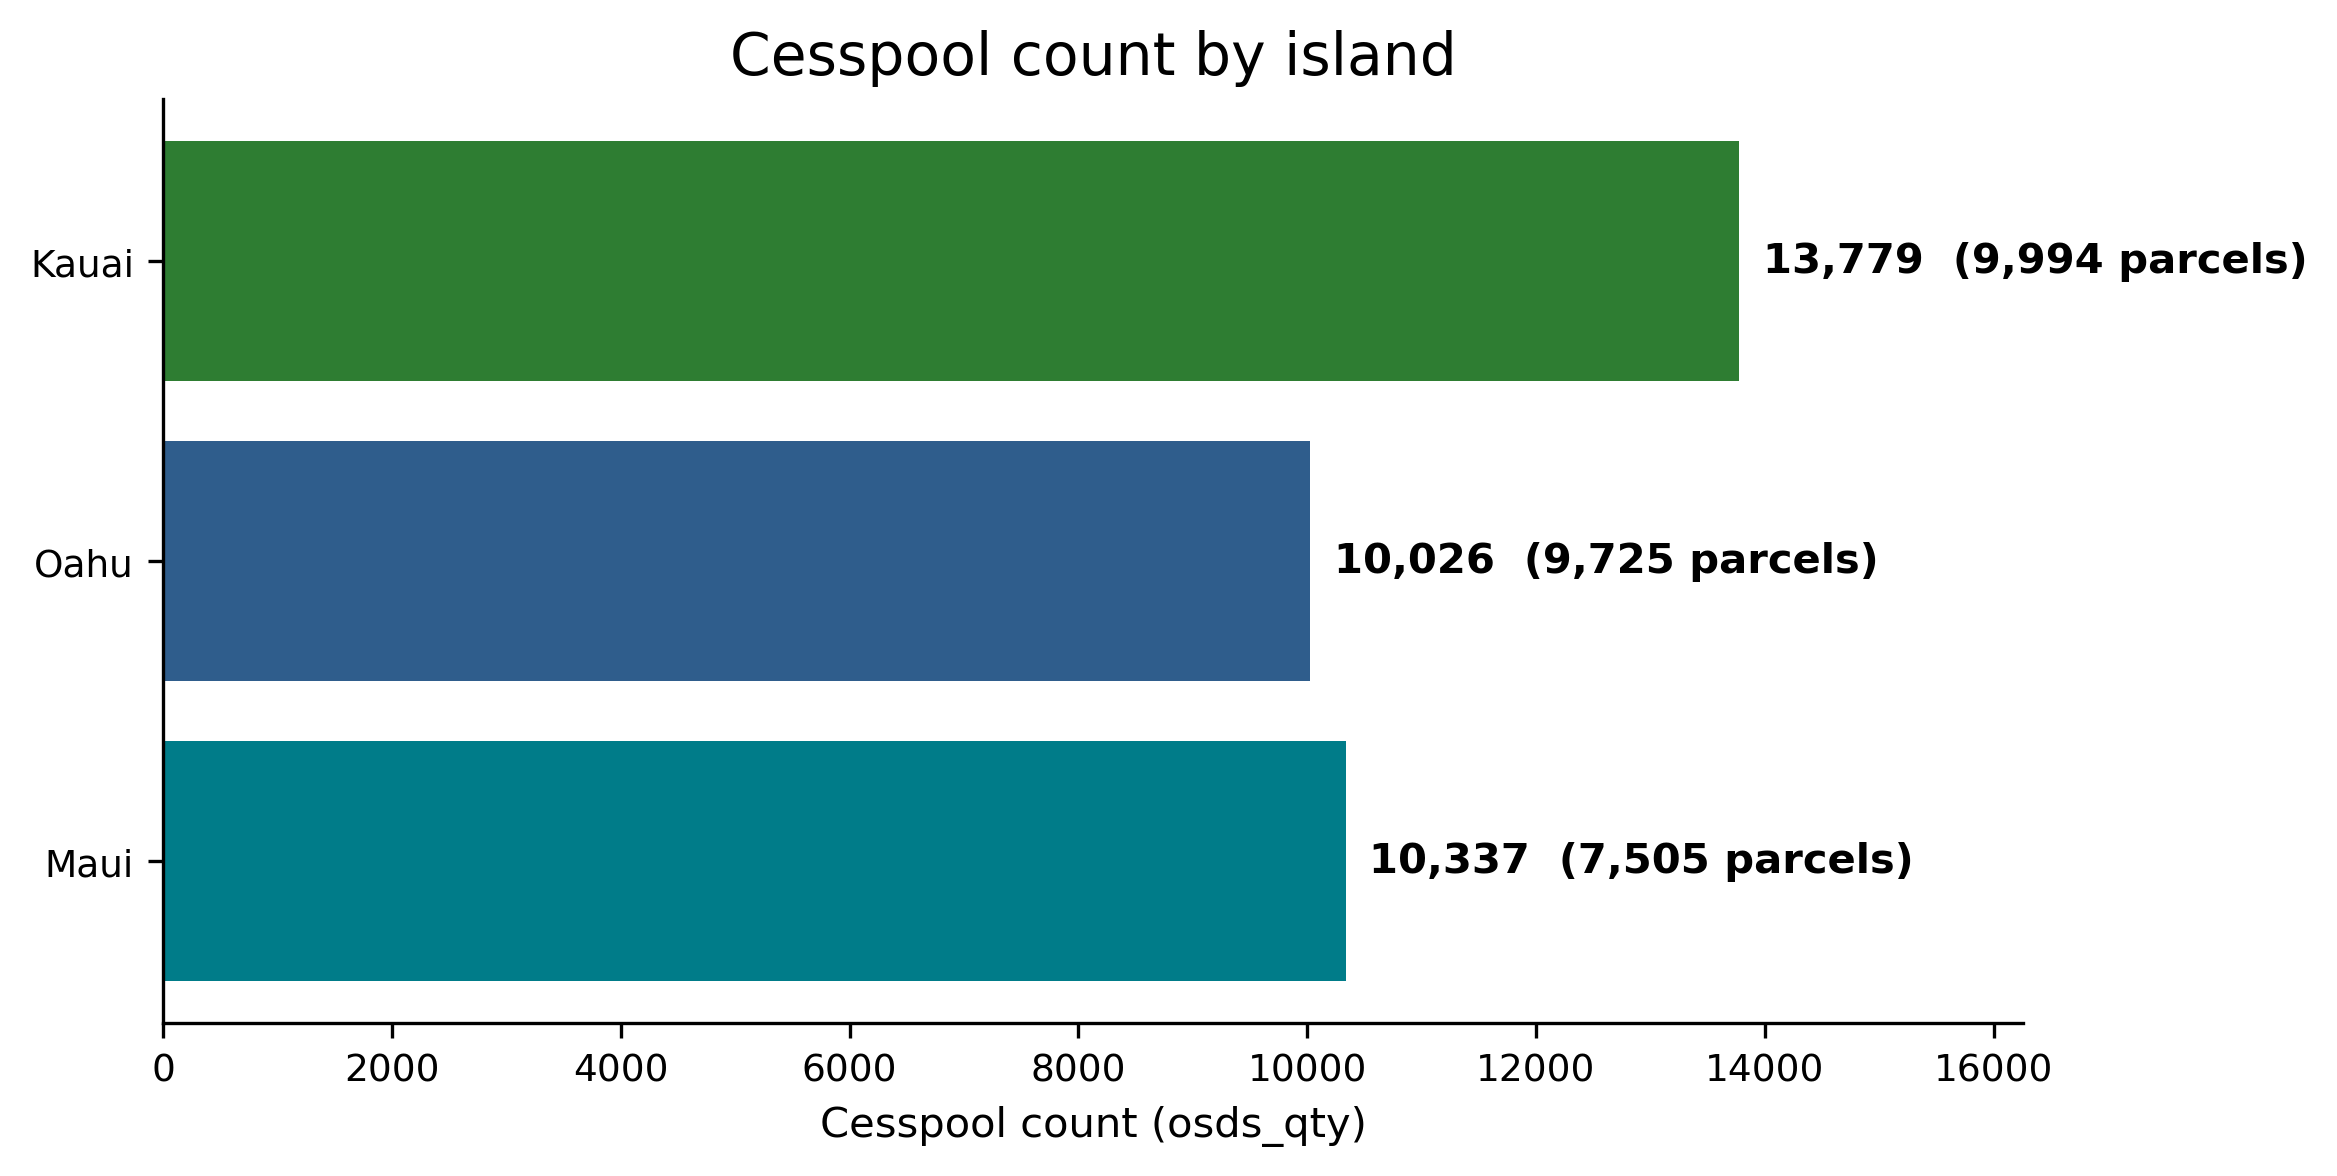
Coverage by island
| Measure | Kauai | Maui | Oahu | Total |
|---|---|---|---|---|
| Cesspool-bearing parcels | 9,994 | 7,505 | 9,725 | 27,224 |
Cesspools (osds_qty) |
13,779 | 10,337 | 10,026 | 34,142 |
Summary statistics
| Column | Min | Median | Max | NA |
|---|---|---|---|---|
depth_to_wt_ft |
1.00 | 155.14 | 9,876.83 | 49 |
net_parcel_area_sqft |
-1,757,446 | 10,371 | 717,010,242 | 0 |
slope_pct |
0.00 | 5.12 | 160.81 | 87 |
dist_to_coast_ft |
0.55 | 6,672 | 54,835 | 0 |
dist_to_dom_well_ft |
5.11 | 7,662 | 63,972 | 0 |
dist_to_mun_well_ft |
15.06 | 5,786 | 70,074 | 0 |
ksat_r |
0.22 | 13.33 | 398.50 | 54 |
avg_rainfall_in |
10.79 | 47.47 | 214.37 | 5 |
Summary graphs
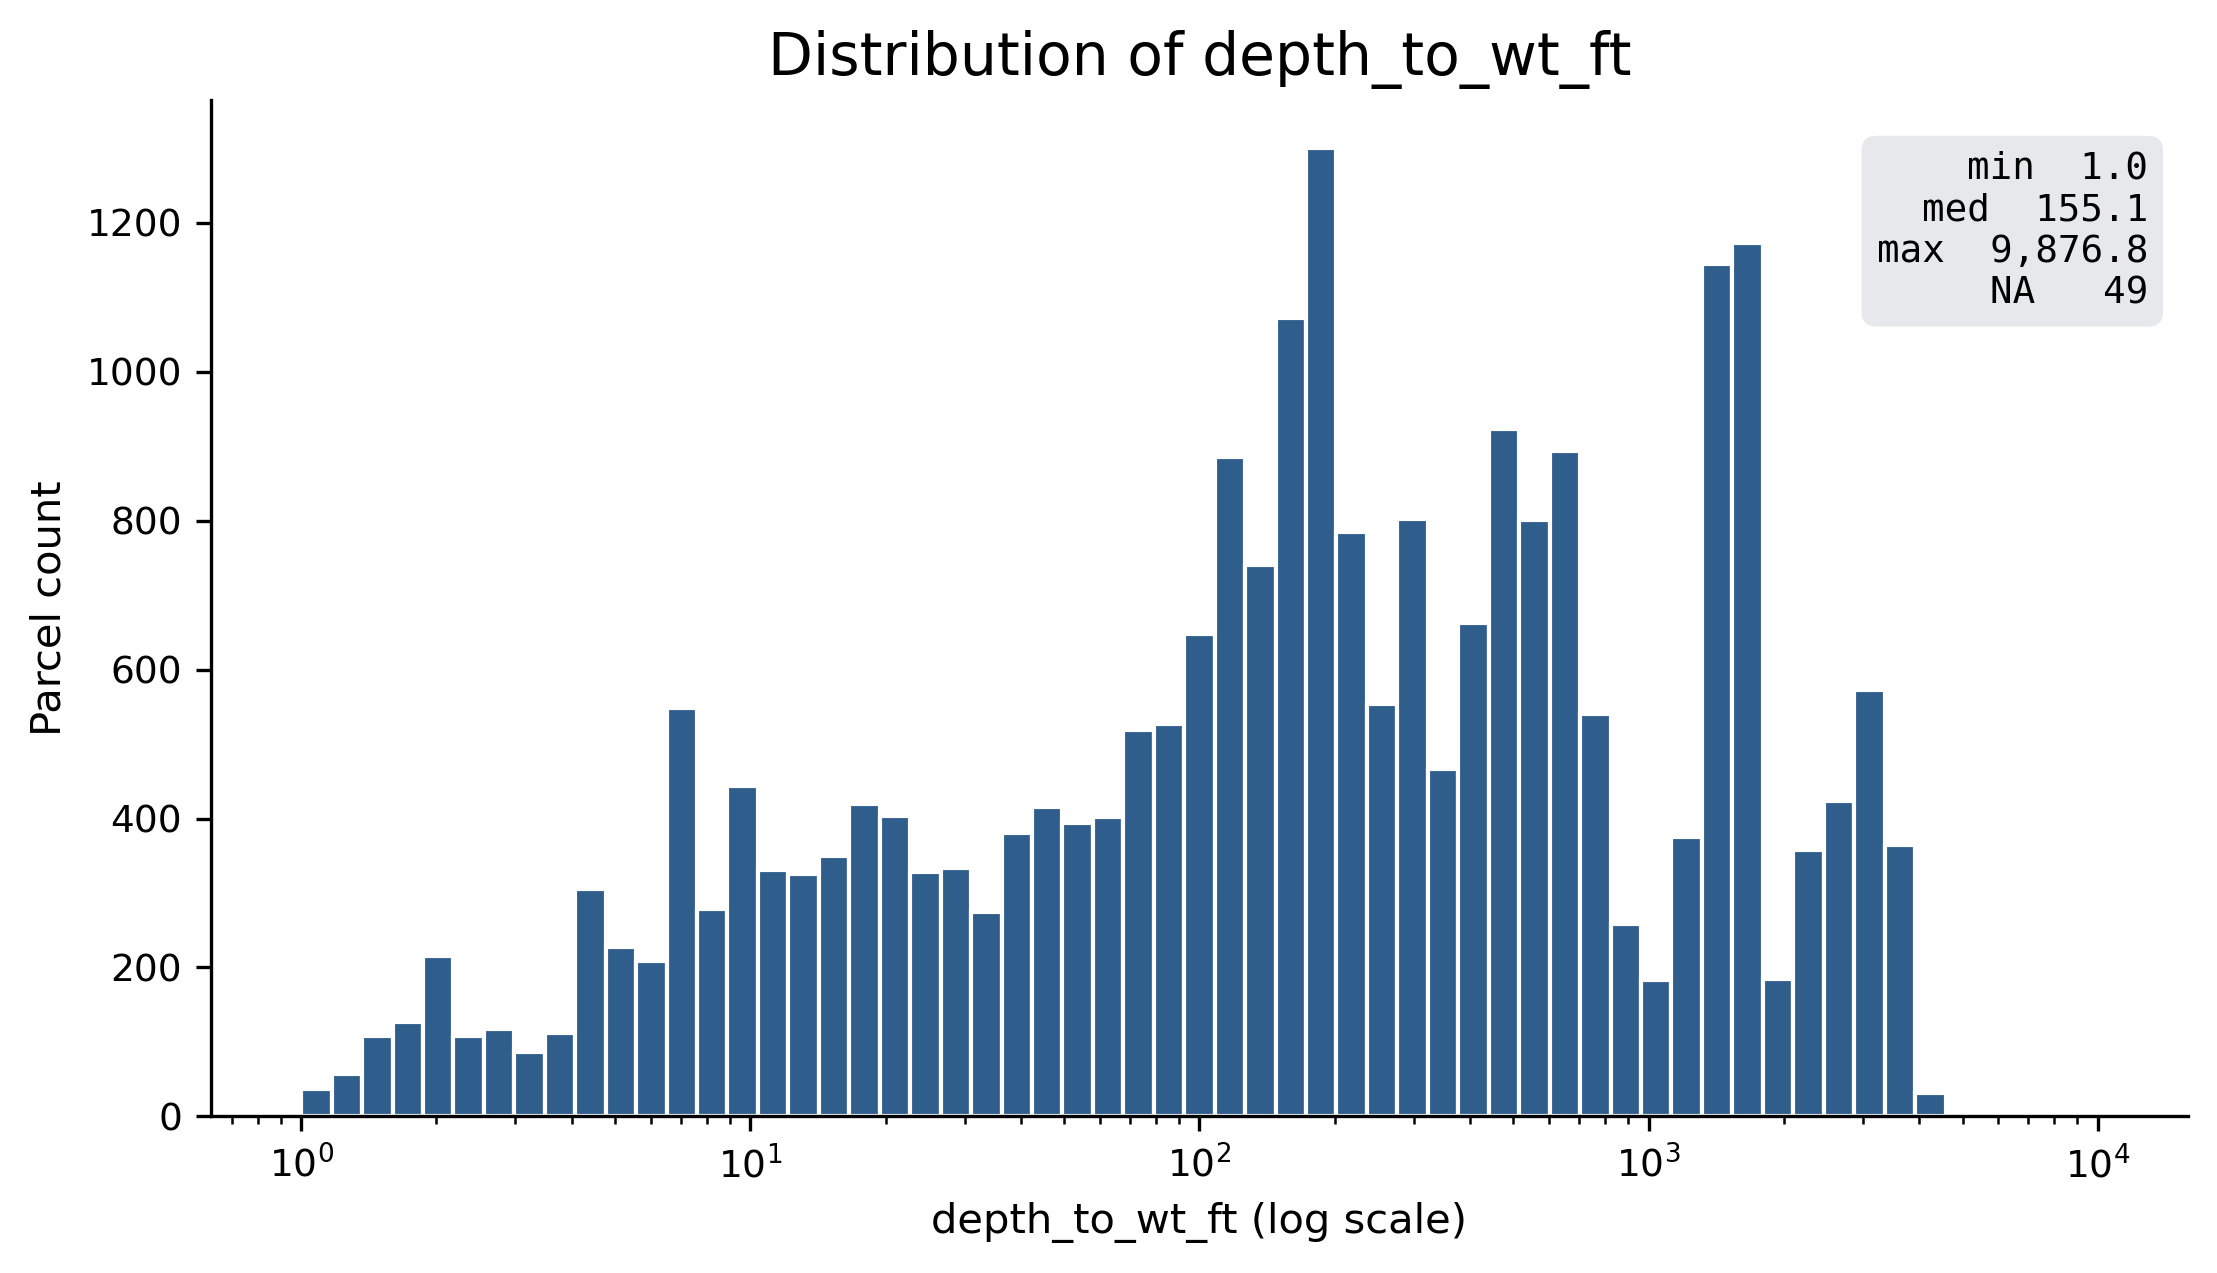
depth_to_wt_ft.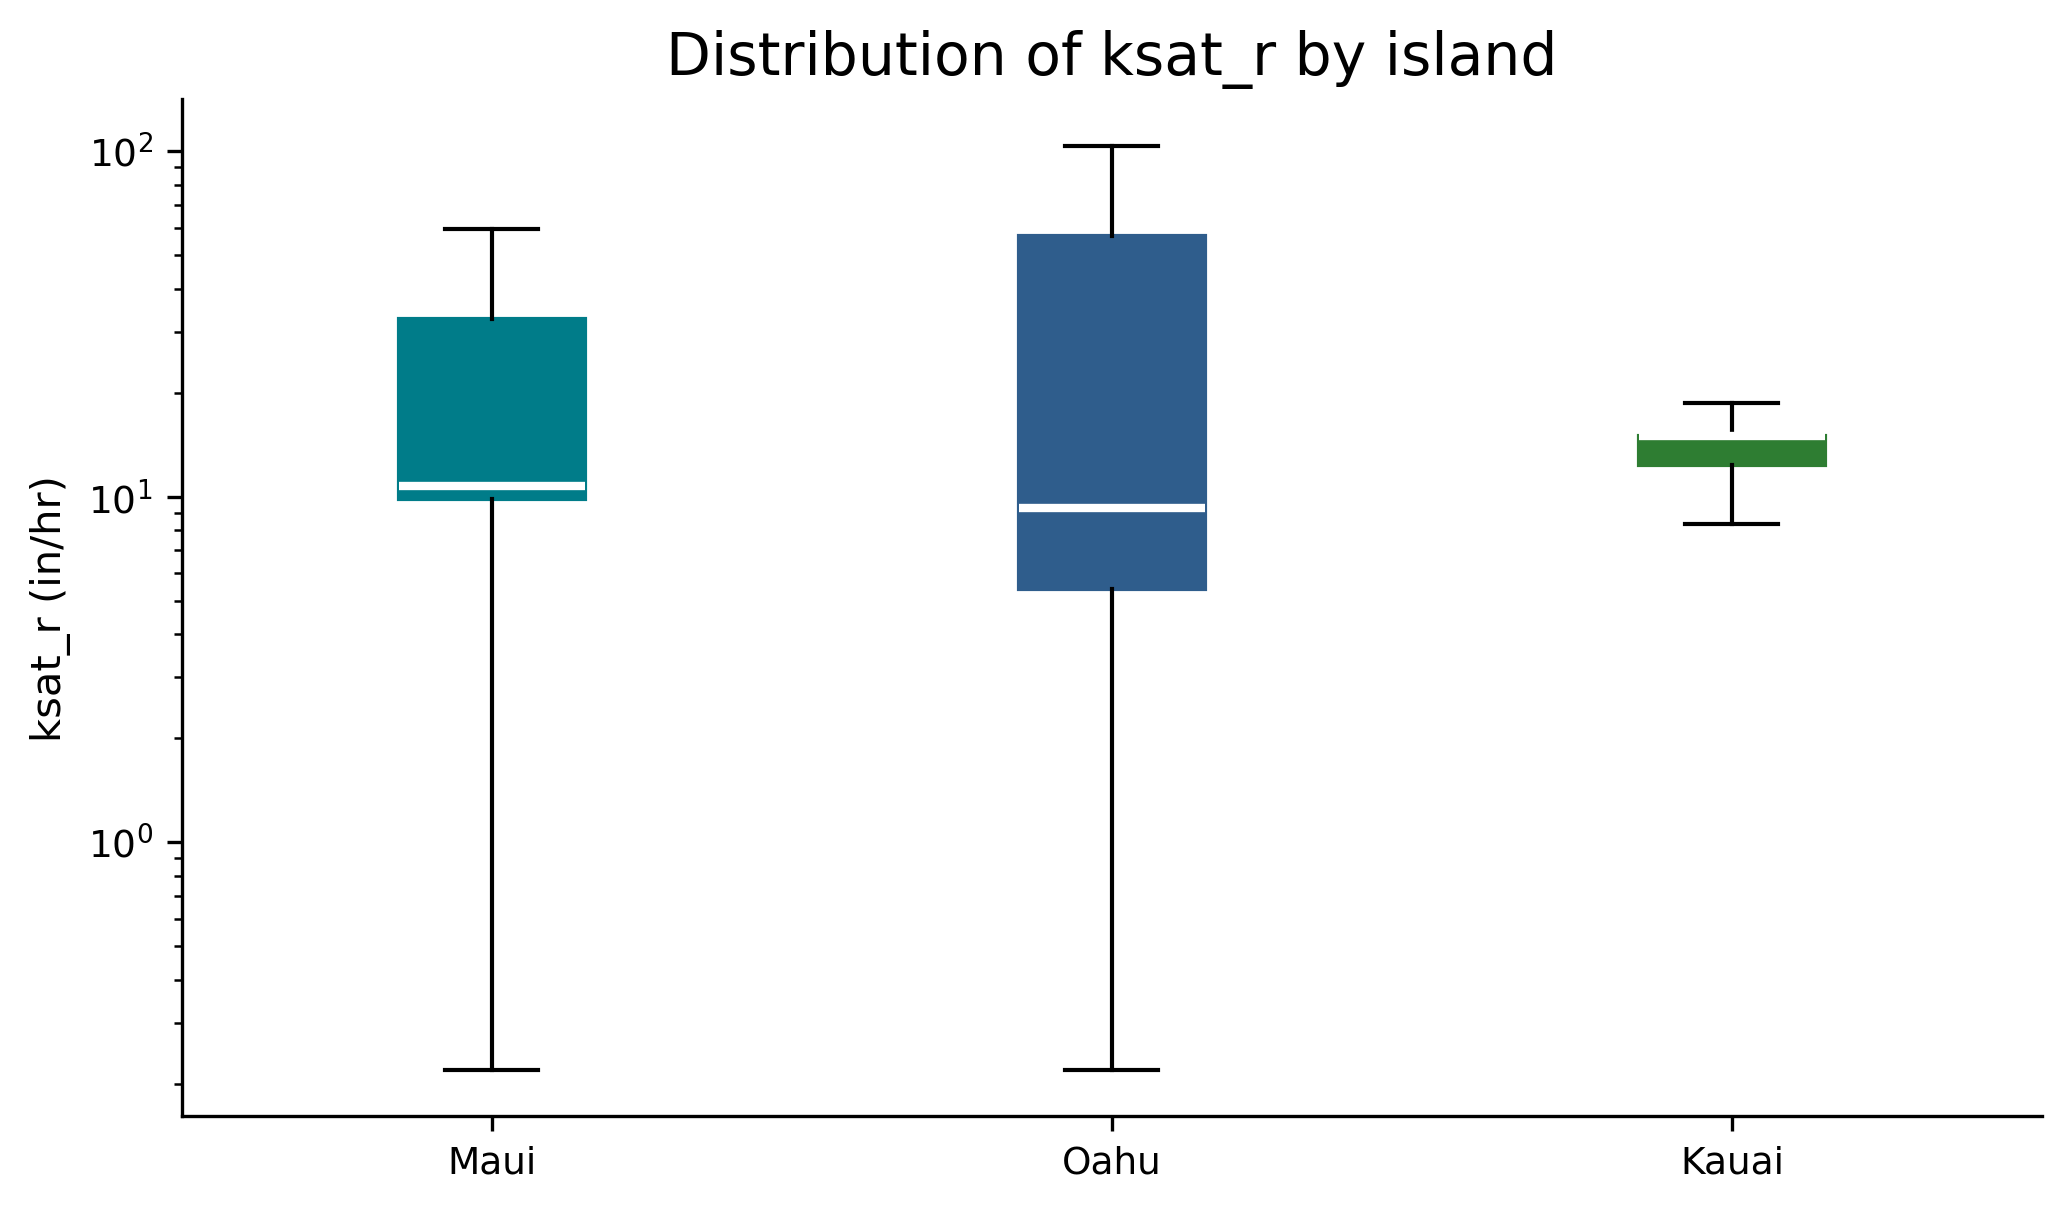
ksat_r by island.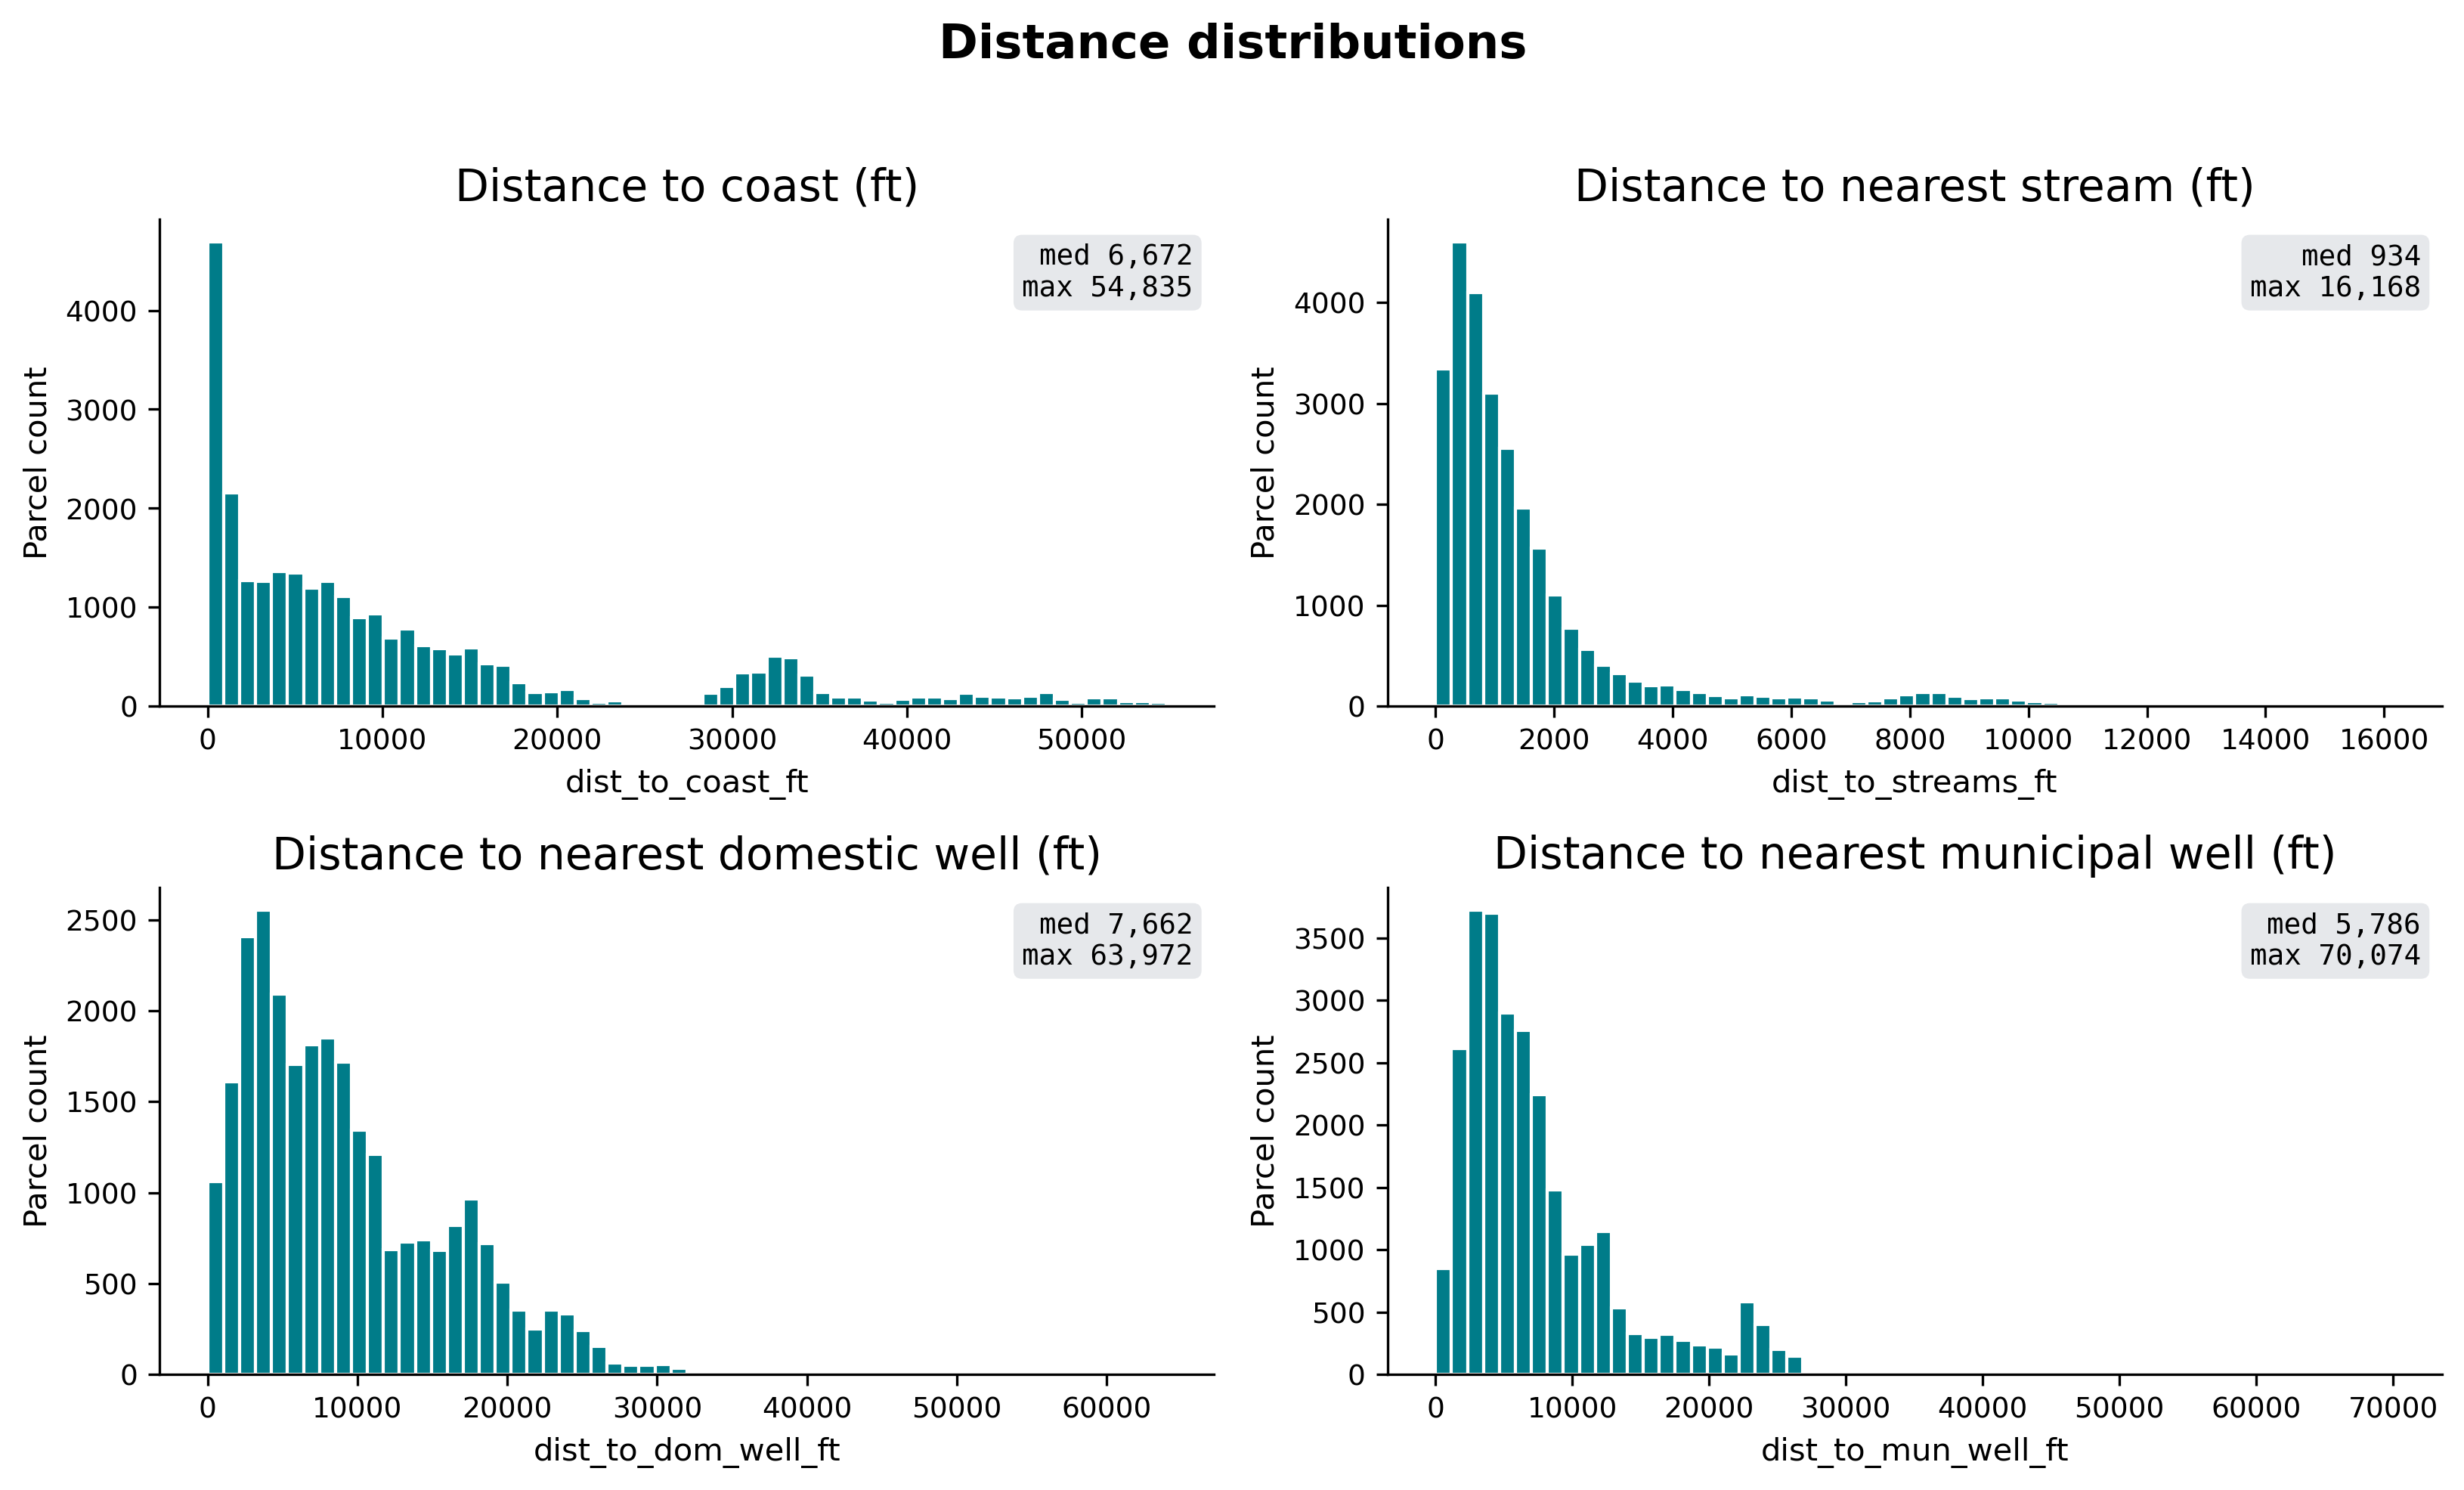
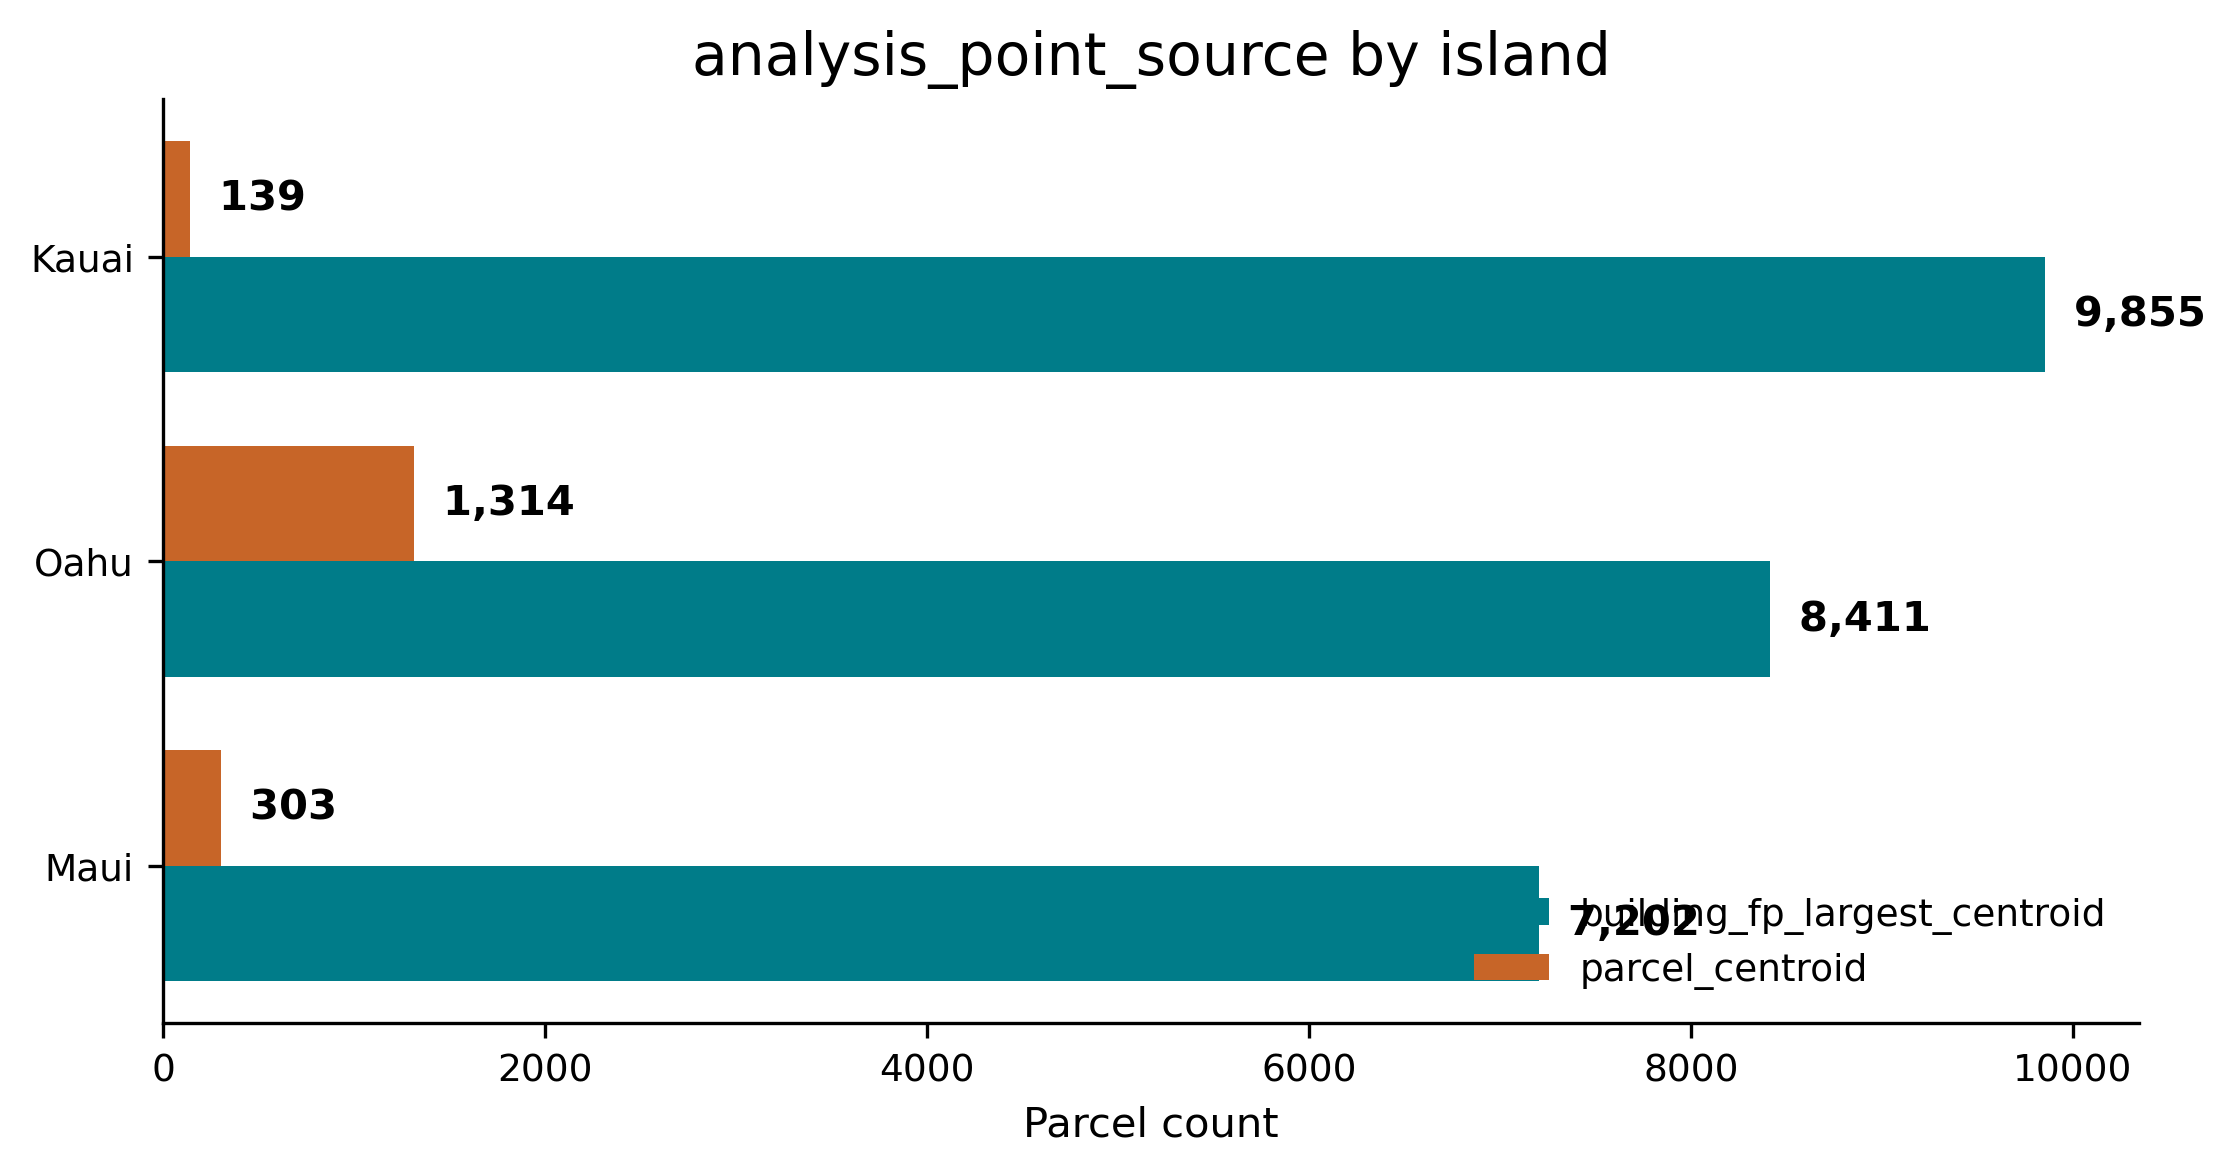
Parcel analysis points
The companion parcel analysis points GeoPackage contains 27,224 point features in EPSG:32604. Columns are tmk, analysis_point_source, and geometry. The file is keyed on the same tmk field as the MPAT.
| Island | building_fp_largest_centroid |
parcel_centroid |
Total |
|---|---|---|---|
| Kauai | 9,855 | 139 | 9,994 |
| Maui | 7,202 | 303 | 7,505 |
| Oahu | 8,411 | 1,314 | 9,725 |
| Total | 25,468 | 1,756 | 27,224 |
Constraint flags
| Field | Value | Count | Percent |
|---|---|---|---|
sfha_tf |
T |
3,280 | 12.05% |
sfha_tf |
F |
23,944 | 87.95% |
analysis_point_source |
building_fp_largest_centroid |
25,468 | 93.55% |
analysis_point_source |
parcel_centroid |
1,756 | 6.45% |
Data quality notes
slope_pcthas 87 NA values.ksat_rhas 54 NA values.depth_to_wt_fthas 49 NA values.avg_rainfall_inhas 5 NA values.net_parcel_area_sqftincludes negative values where building-footprint area exceeded parcel area. See Screen Techs for the screening handling note.